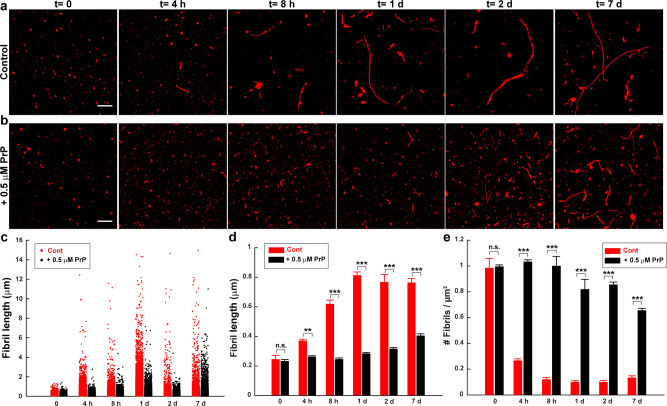
Fig. 2. PrP slows the growth of Aβ fibrils.
Aβ-Cy5 monomer (20 µM) was polymerized for the indicated times in the presence of 0 µM (a) or 0.5 µM (b) PrP-AF555. Fibrils were then imaged by SIM. Scale bar in (a, b) (t = 0) is 1 µm. c Distributions of fibril lengths at each time point in the presence of 0 µm (red dots) or 0.5 µM PrP-AF555 (black dots). Each dot represents an individual fibril. d, e Bars indicate the mean length of fibrils (d) and the number of detectable Aβ-Cy5 fibrils/μm2 (e) at each time point for 0 and 0.5 µM PrP-AF555. Data represent mean ± S.E. *P < 0.05, **P < 0.01 and ***P < 0.001 (two-sided Student’s t-test). The numbers of biological independent samples (N) and analyzed images (X) in each conditions are: N ≥ 3, X ≥ 6.

