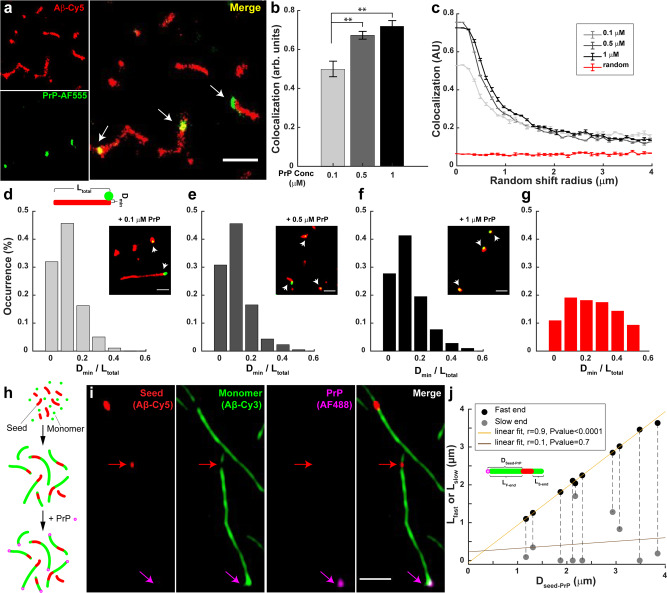
Fig. 4. PrP binds exclusively to the fast-growing end of Aβ fibrils.
a dSTORM images of Aβ-Cy5 (20 µM) polymerized for 24 h in the presence of 0.5 µM PrP-AF555. Arrows in the merged image indicate the localization of PrP near the ends of Aβ fibrils. Scale bar is 1 µm. b Bars indicate the colocalization between Aβ and PrP-AF555 at different concentration of PrP. Data represent mean ± S.E. **P < 0.01 and ***P < 0.001 (two-sided Student’s t-test). c Colocalization between Aβ and PrP decays after a set of random direction shifts, and approaches the values derived from unrelated PrP and Aβ images from two different experiments (red line). Error bars represent mean ± S.E. d–f Aβ-Cy5 (20 µM) was polymerized for 24 h in the presence of either 0.1 µM, 0.5 µM, or 1 µM PrP-AF555, and samples were imaged by SRM. Histograms show the distribution of Dmin/Ltotal values (see cartoon in d) for 95-227 fibrils with associated PrP spots. Insets show the dSTORM images of Aβ fibrils (red) formed in the present of different concentration of PrP-AF555 (green). Scale bars are 0.5 µm. g Random distribution of Dmin/Ltotal values derived from unrelated PrP and Aβ images from two different experiments. The number of analyzed SIM images in +0.1 µM PrP, +0.5 µM PrP, +1 µM PrP and random condition are: X = 14; 10; 10, and 17, respectively. h Schematic representation of three-color imaging assay. i Individual fibrils imaged for Cy5 (Aβ seed), Cy3 (Aβ monomer), AF488 (PrP), and a merge of the three colors. The magenta arrow indicates PrP bound to the fast-growing end of a single fibril. The red arrow indicates the position of the seed. Scale bar is 1 µm. j Distance between the seed and the PrP spot (Dseed-PrP) plotted against the lengths of the fast- and slow-growing ends (Lfast and Lslow, respectively) for 10 separate fibrils. The pairs of black and gray dots connected by a dotted line correspond to the two ends of each fibril. r represent Pearson’s correlation coefficient and corresponding P-value calculated using a two-sided Student’s t test.

