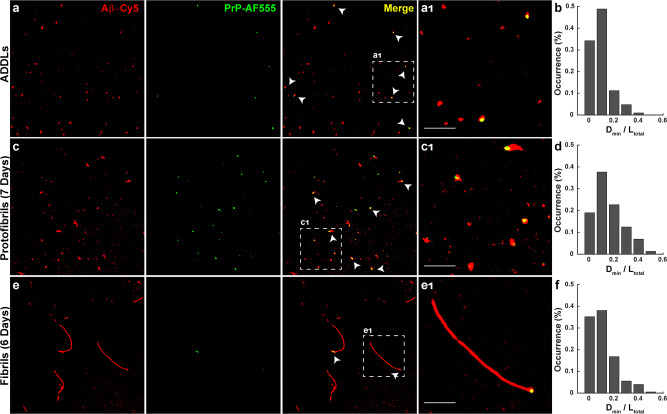
Fig. 5. Localization of PrP on neurotoxic Aβ assemblies.
Pre-formed ADDLs (a), protofibrils (c), and fibrils (e) (all at 20 µM monomer-equivalent concentration) were incubated with 0.5 µM PrP-AF555 and then imaged by dSTORM. Panels a1, c1, and e1 show boxed areas in (a, c, e), respectively, at higher magnification. Scale bars are 1 µm. Histograms (b, d, f) show the distribution of Dmin/Ltotal values, calculated as in Fig. 4, for ADDLs, protofibrils, and fibrils, respectively. The number of analyzed SIM images in oligomer, protofibrils, and fibrils condition are: X = 6; 10 and 18, respectively.

