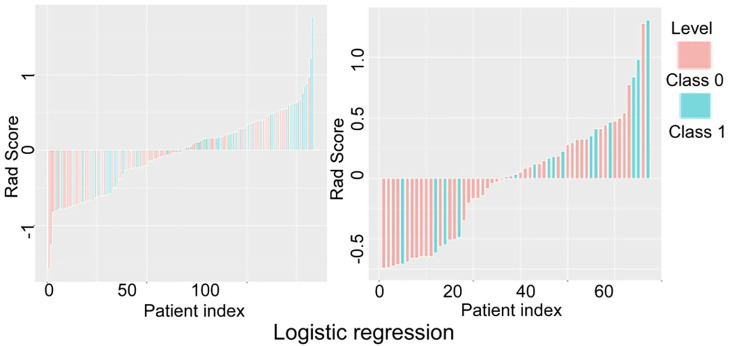
Figure 5.
Verification and comparison of the logistic regression model in predicting low and high grade renal cell carcinoma in the training and testing set. In the training set, the true negative rate (specificity) for predicting grade I-II clear cell renal cell carcinoma (ccRCC) was 60.5% (49/81), and the true positive rate (sensitivity) for predicting grade III-IV ccRCC was 65.4% (34/52). In the testing set, the true negative rate was 53.7% (22/41) for predicting grade I-II ccRCC and 75% (12/16) for predicting grade III-IV.

