FIGURE 3.

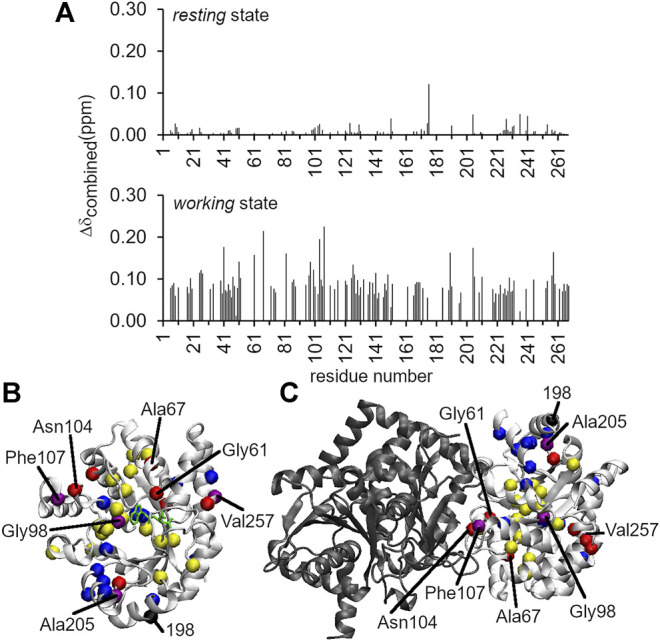
Long-range structural and dynamic changes induced by the A198W substitution. (A) 1H–15N chemical shift perturbations induced by the A198W substitution. The Δδ combined values were determined according to the equation, (Δδ combined = (Δδ HN 2 + (Δδ N/5)2)0.5, where Δδ HN and Δδ N were the 1H and 15N amide chemical shift differences between WT and A198W. Chemical shift differences between WT and A198W αTS are shown for both the ligand-free resting state (top; average Δδ combined < 0.01 ppm), and the actively turning over working state (bottom; average Δδ combined = 0.04 ppm). Residues with Δδ combined values greater than 0.15 ppm and between 0.10 and 0.15 ppm for the working state are plotted as red and yellow spheres, respectively, onto the structures of (B) αTS and (C) the full TS complex. Network residues are plotted as blue spheres, or as purple spheres if they met the Δδ combined thresholds (i.e., > 0.10 ppm). Most of the network residues showed chemical shift perturbations but may not have met this threshold. It should be noted that NMR experiments were performed in the absence of βTS (shown in black).
