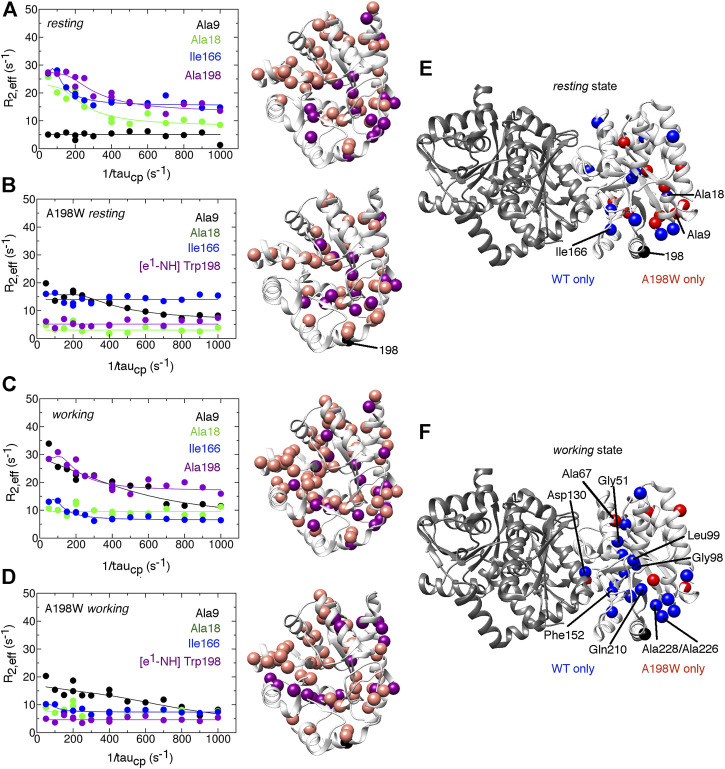
FIGURE 4.
The A198W surface-exposed, network substitution suppresses millisecond conformational motions in αTS. Conformational exchange events in E. coli αTS enzyme for (A) WT ligand-free resting, (B) A198W ligand-free resting, (C) WT working and (D) A198W working states. (Left) Example 15N R2 relaxation dispersion curves collected at a 1H Larmor frequency of 850 MHz for resonances belonging to Ala9 (black), Ala18 (green), Ile166 (blue), and the sidechain ε1-NH group of Trp198 (purple). (Right) Locations of conformational exchange according to the R2 relaxation dispersion curves plotted as spheres onto the αTS structure. Purple spheres indicate that associated R2 relaxation dispersion curves can be fit to two-site exchange, while pink spheres indicate exchange broadening, but the R2 relaxation dispersion curves cannot be fit reliably to two-site exchange. Comparison of the conformational exchange events between WT and A198W αTS for (E) resting and (F) working states is also shown. Blue (red) spheres indicate conformational exchange events present in the WT (A198W) enzyme but not in the A198W (WT) enzyme. It should be noted that the NMR data was collected in the absence of βTS. The 15N R2 relaxation dispersion experiments were conducted at 283 K using a buffer consisting of 50 mM potassium phosphate, pH 7.8, 2 mM DTT, 0.2 mM Na2EDTA, and 10% 2H2O, and 0.5–1.0 mM protein with 10 mM indole, and/or 20 mM G3P, where appropriate.

