Figure 2.
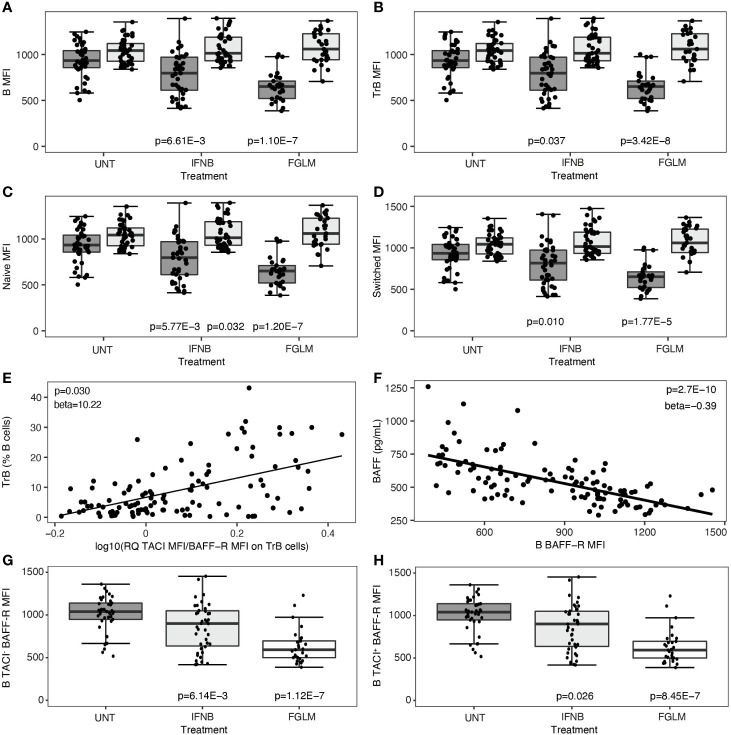
B cell surface expression of BAFF-R and TACI according to treatment status. Association of treatment status (UNT = untreated, IFNB = interferon- β, FGLM = fingolimod) with mean fluorescence intensity (MFI) of BAFF-R (dark grey) and TACI (light grey) on (A) total B, (B) transitional B, (C) naïve B and (D) switched memory B cells (NUNT = 41, NIFNB = 42, NFGLM = 29). (E) Correlation of transitional B cells with the ratio of the mean fluorescence intensity (MFI) of TACI on BAFF-R on transitional B cells. (F) Correlation between BAFF-R expression level on total B cells and BAFF plasma concentration. Association of treatment status with mean fluorescence intensity (MFI) of BAFF-R on (G) TACI- total B and (H) TACI+ total B cells (NUNT = 41, NIFNB = 42, NFGLM = 29). P values ≤ 0.05 are depicted. For plot (A–D, G, H): P values were calculated with a linear regression of the immunological or expression variable in function of treatment status with age and gender as a covariate. For plot (E, F): P values were calculated with a linear regression of BAFF plasma level/TrB cells in function of receptor expression levels with age, gender and treatment status as a covariate. We measured expression of BAFF-R and TACI as mean of fluorescence intensity (MFI) across positive cells for each cell type. Box-whisker plots represent median, quartiles and 1.5 x IQR.

