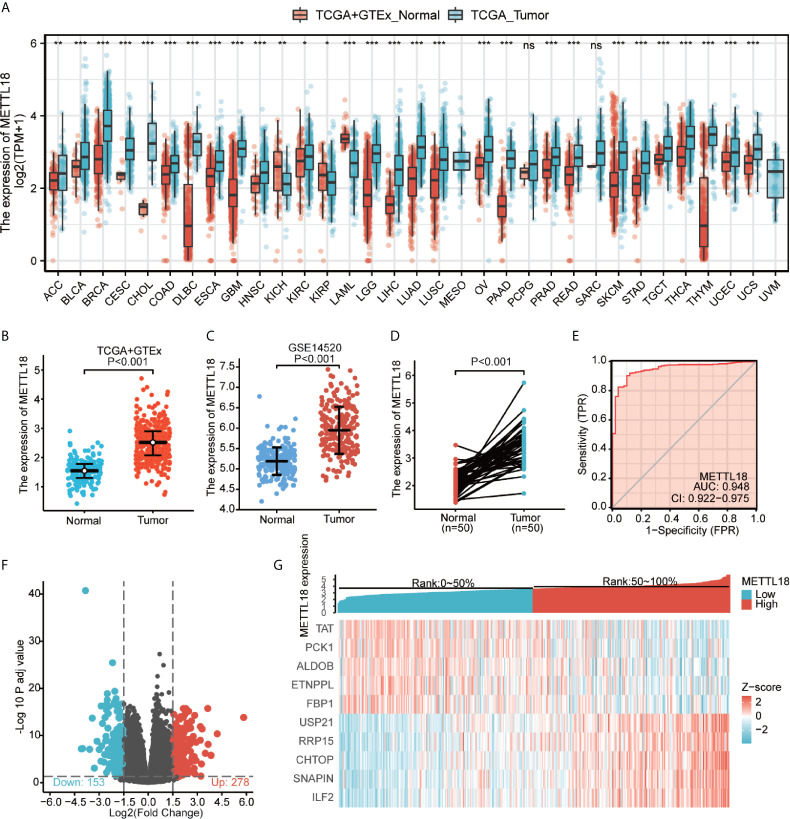
Figure 1.
The expression levels of METTL18 in different cancers and METTL18-associated differentially expressed genes (DEGs). (A) Increased or decreased METTL18 of different cancers compared with normal tissues in the TCGA and GTEx database. (B–D) The expression levels of METTL18 in HCC. (E) A ROC curve to test the value of METTL18 to identify HCC tissues was drawn. (F, G) Volcano plots of the DEGs and heat map demonstrating the top 10 DEGs. *p < 0.05, **p < 0.01, ***p < 0.001, NS, no significance.

