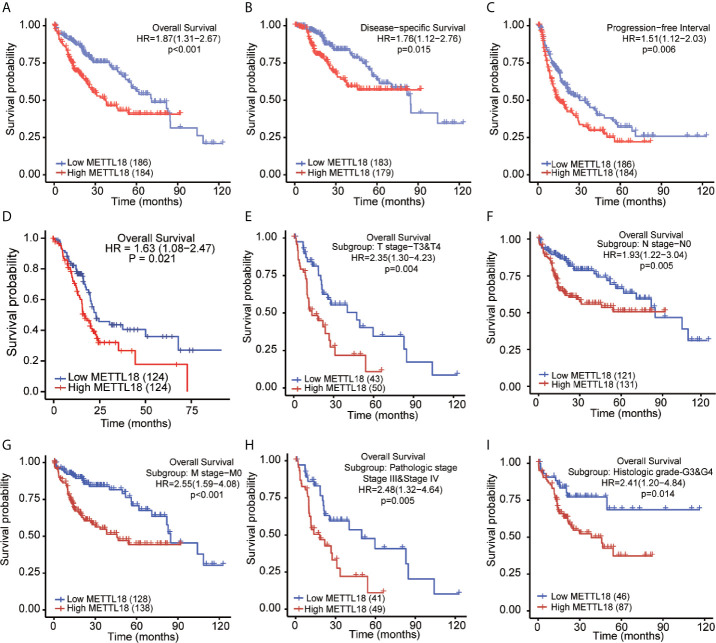
Figure 5.
Kaplan–Meier survival plots comparing the low and high expression of METTL18 in HCC. (A–D) Survival curves of OS, DSS, and PFI between high and low expression of METTL18 in patients with HCC. (E–I) OS survival curves of T stages 3 and 4, N0, M0, pathologic stages III and IV, and G3 and 4 subgroups between METTL18-high and -low patients with HCC. HCC, hepatocellular carcinoma; OS, overall survival; DSS, disease specific survival; PFI, progression free interval.

