Figure 1.
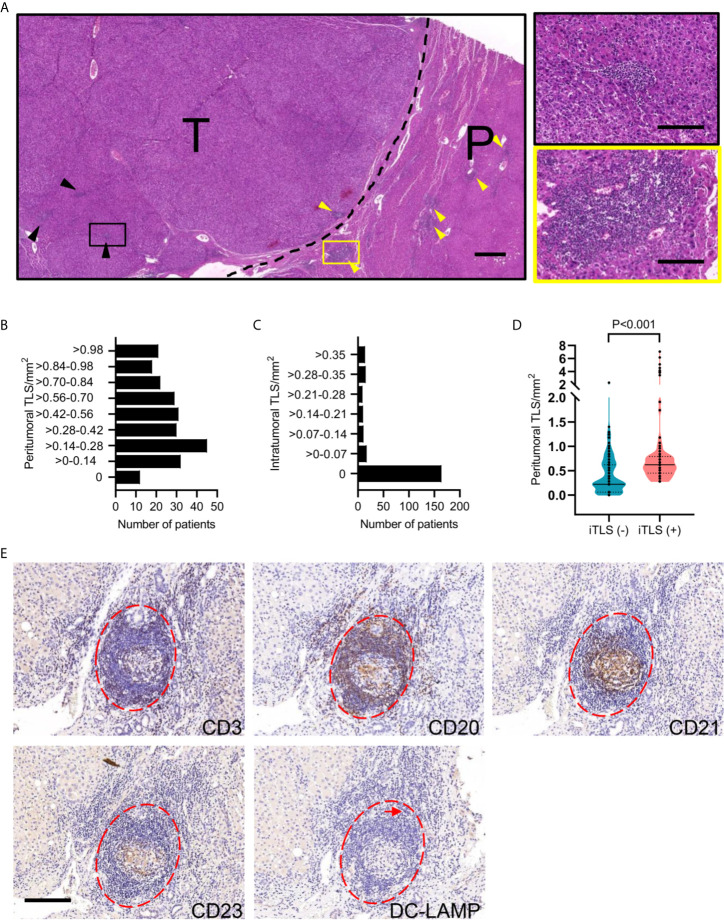
Characterization of HCC-associated TLS. (A) Representative images of H&E-stained HCC tissues showing iTLS (black arrowheads and right zoomed-in segment) in tumor tissue and pTLS (yellow arrowheads and right zoomed-in segment) surrounding the HCC tissues. The black dotted line represents the invasive margin of HCC. Scale bar, left 500 μm; right, 50 μm. (B, C) The density of TLS was determined in peritumoral and intratumoral regions in 240 patients with HCC. (D) The density of pTLS was compared between HCC patients present or absent with iTLS. Groups were statistically compared using Mann–Whitney U-test. (E) Representative images showing components and structure of TLS using consecutive sections. Lymphoid aggregates (red dotted lines) in human HCC specimens are composed of CD3+ T cells, CD20+ B cells, CD21+ FDCs, CD23+ GC cells, and DC-LAMP+ mature DCs (arrow). Scale bar, 100 μm. HCC, hepatocellular carcinoma; T, tumor tissue; P, peritumoral tissue; iTLS, intratumoral tertiary lymphoid structure; pTLS, peritumoral tertiary lymphoid structure; FDC, follicular dendritic cell; GC, germinal center; DC, dendritic cell.

