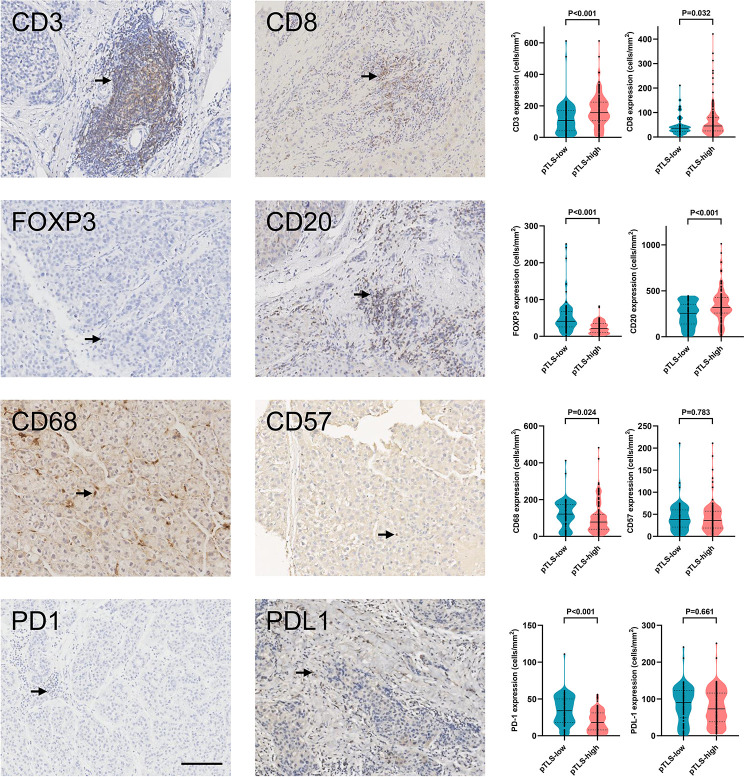
Figure 5.
pTLS density correlates with tumor-infiltrating immune cells. Representative images of main tumor-infiltrated immune cells (left panel) and relative statistical analyses (right panel) of tumors with low or high pTLS densities. Black arrows represented positive staining. Groups were statistically compared using Mann–Whitney U-test. Scale bar, 100 μm. iTLS, intratumoral tertiary lymphoid structure; pTLS, peritumoral tertiary lymphoid structure.

