TABLE 4.
Summary of intracranial contact pressure outcomes across each region of interest.
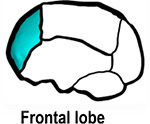 |
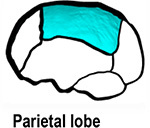 |
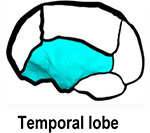 |
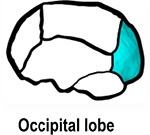 |
 |
||||||||||||
| Bone formation method: | Model | Min | Max | Mean | Min | Max | Mean | Min | Max | Mean | Min | Max | Mean | Min | Max | Mean |
| Scenario I | Model I | 0 | 17.36 | 1.65 | 0 | 20.82 | 2.19 | 0 | 20.61 | 1.83 | 0 | 22.94 | 1.45 | 0 | 17.49 | 2.17 |
| Model II | 0 | 15.40 | 2.29 | 0 | 18.62 | 2.68 | 0 | 22.63 | 2.33 | 0 | 16.95 | 1.87 | 0 | 20.46 | 2.86 | |
| Scenario II | Model I | 0 | 8.83 | 5.98 | 0 | 10.97 | 5.69 | 0 | 18.55 | 5.66 | 0 | 11.37 | 5.94 | 0 | 11.61 | 6.64 |
| Model II | 0 | 18.58 | 6.41 | 0 | 23.28 | 6.08 | 0 | 20.82 | 6.06 | 0 | 31.57 | 6.39 | 0 | 31.98 | 6.88 | |
Values are in MPa.
