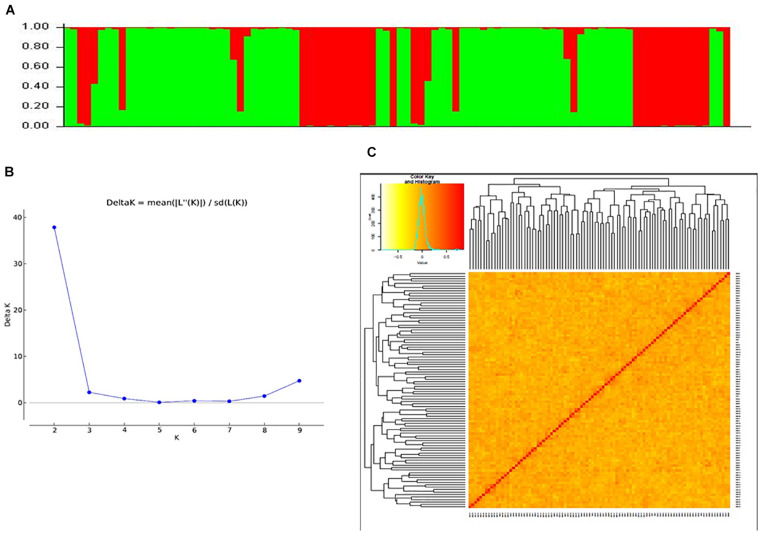
FIGURE 3.
(A) Bar graph for population structure of cotton genotypes performed by admixture method in STRUCTURE, which grouped all accessions into two clusters. (B) Estimation of number of clusters using ΔK values for K ranging from 2 to 10. (C) Heat map plot displaying relationships of 96 cotton genotypes based on SSR markers.

