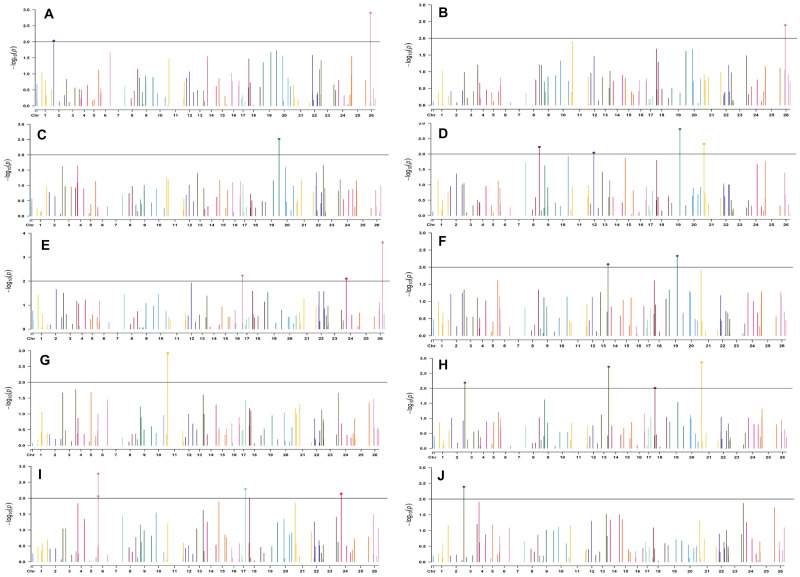
FIGURE 5.
Manhattan plots for the early sown environment of 2018 for various traits under study by the MLMM model. Significant marker above threshold {at –log10 (p) > 2} is highlighted with bold dot head on the marker’s line. (A) Days to first flower, (B) plant height, (C) number of monopods, (D) number of bolls per plant, (E) boll weight, (F) seed cotton yield per plant, (G) ginning out turn, (H) lint yield, (I) seed index, and (J) lint index.

