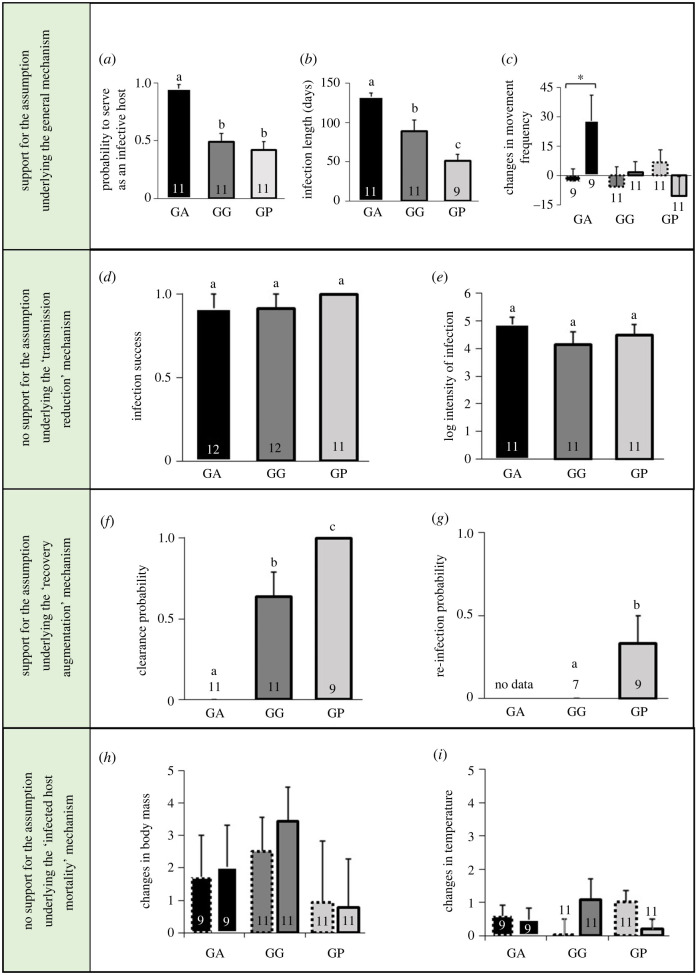
Figure 2.
Results supporting or not supporting the assumptions underlying potential diversity–disease mechanisms. Means and standard errors of the various variables measured in the three host species. These variables were used to test the assumptions underlying the general mechanism of one amplifier and two diluter species (a–c), the ‘transmission reduction’ (d,e), ‘recovery augmentation’ (f,g) and ‘infected host mortality’ (h,i) mechanisms. (a) The overall probability of each host species to serve as an infective host, which was calculated throughout the experiment following the first infection. (b) The infection length of each host species, which was calculated from the first to the last days of confirmed infection. (c) Changes in the movement frequency (number of movement bouts in 12 h) of infected (columns with a continuous frame) and control (columns with a dashed frame) individuals of the three species, between the stages of the first reduction and pre-inoculation. The changes were standardized for each individual by dividing the differences by the pre-inoculation values. (d) The probability of a host from each species to become infected by the first inoculation. (e) The log-transformed intensity of infection per infected individual of each host species (cells per µl of blood) throughout the experiment. (f) The probability of a host from each species, who became infected, to clear the infection. (g) The probability of a host from each species, who had cleared the infection, to become infected by a repeated inoculation. (h,i) Changes in the body mass (grams; h) and surface body temperature (°C; i) of infected (columns with a continuous frame) and control (columns with a dashed frame) individuals of the three species, between the stages of the first reduction and pre-inoculation. The changes were standardized for each individual by dividing the differences by the pre-inoculation values. Numbers in columns represent the sample sizes. Different letters above columns and asterisk indicate significant planned comparisons.

