
Figure 2.
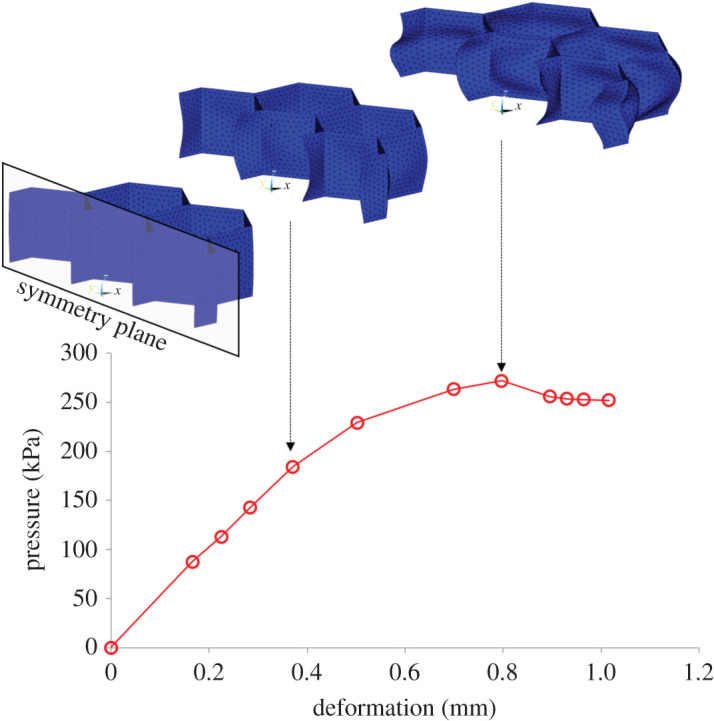
The numerically simulated pressure–deformation graph for a sample with the same geometry as the one used in mechanical testing (w = 6.5 mm, t = 0.5 mm, h = 5 mm). The FE model used in this simulation is also shown in its original/undeformed shape and in two different deformed states.