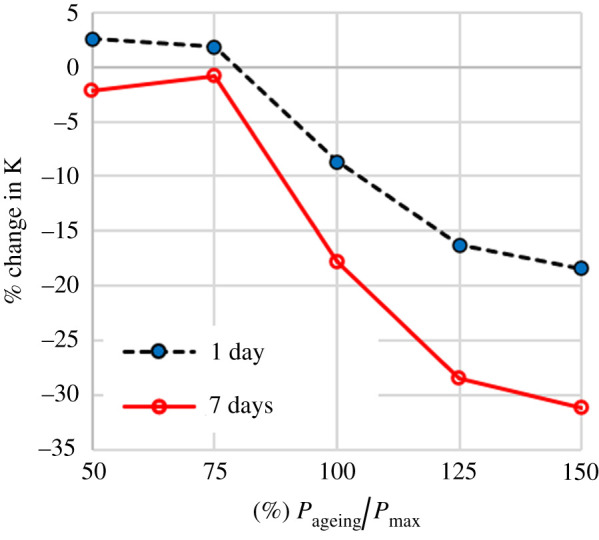
Figure 4.

The effect of simulated use for 1 or 7 days on the equivalent stiffness (K) for different magnitudes of the applied ageing load. The magnitude of ageing load is presented as the % ratio of the maximum applied pressure in each load/unload cycle (Pageing) over the maximum pressure of the sample's pressure–deformation graph (Pmax).
