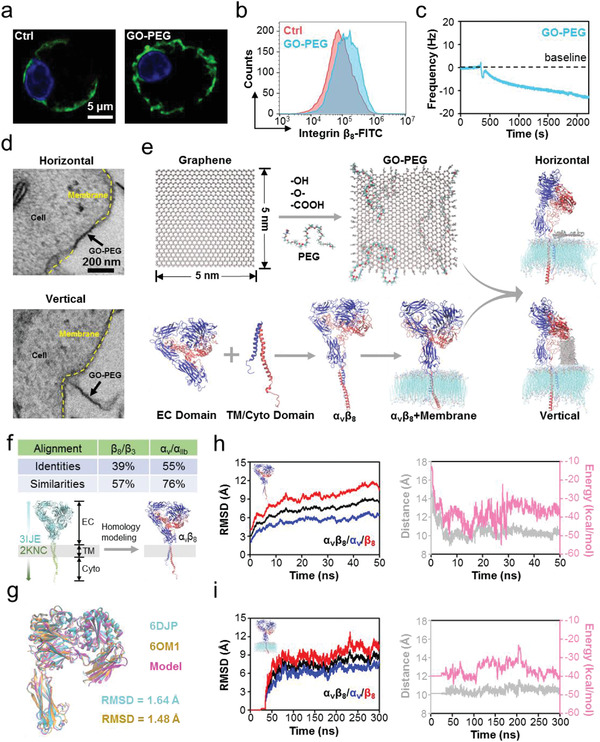
Figure 1.

Nano–bio interface interaction and the corresponding ternary coupling model comprising PEGylated graphene oxide (GO‐PEG), integrin, and membrane. a) Confocal laser scanning microscope images of integrin β 8 (green) on peritoneal macrophages with and without GO‐PEG stimulation. The expression of integrin β 8 is higher after GO‐PEG stimulation. b) Flow cytometry analysis of integrin β 8 on peritoneal macrophages with and without GO‐PEG stimulation. It also proves the higher expression of integrin β 8. c) QCM curves of GO‐PEG flowing across a macrophage membrane spin‐coated on the chip to detect the mechanical interaction of nano–bio interface. The downward frequency reflects an increased quality on the chip in response to the bound GO‐PEG. d) Nano–bio interface interaction mode of GO‐PEG and a macrophage imaged via TEM. Upper panel, horizontal mode; lower panel, vertical mode. e) Construction of the ternary model comprising GO‐PEG, α v β 8, and a POPC bilayer. The GO‐PEG and POPC bilayer models were built using VMD plugins; the α v β 8 model was built using a standard homology modeling method. The interaction mode between GO‐PEG and the POPC bilayer includes horizontal and vertical modes. Blue, α subunit of α v β 8; Red, β subunit of α v β 8. f) Sequence alignment of the primary sequences between α v β 8 and its templates, and schematic diagram of homology modeling. g) Comparison between homology modeling‐based α v β 8 model and α v β 8 crystal structure. Pink, homology modeling model; Cyan, crystal structure (PDB ID: 6DJP); Orange, crystal structure (PDB ID: 6OM1). The RMSD is calculated by superimposing the protein backbone atoms; the low RMSD values validate the reliability of homology modeling. h) α v β 8 model stability during equilibrium simulation. Left panel: RMSD calculations for α v β 8, α subunit, and β subunit. Right panel: centroid distance and noncovalent interaction energy of the TM domains. These parameters were stable after 50 ns equilibrium simulation, indicating that the terminal structure can be utilized in the subsequent simulations on membrane. i) α v β 8 stability on membrane during equilibrium simulation. Left panel: RMSD calculations for α v β 8, α subunit, and β subunit. Right panel: centroid distance and noncovalent interaction energy of TM domains. These parameters were stable after 300 ns equilibrium simulation, indicating that the terminal structure can be utilized in production simulation.
