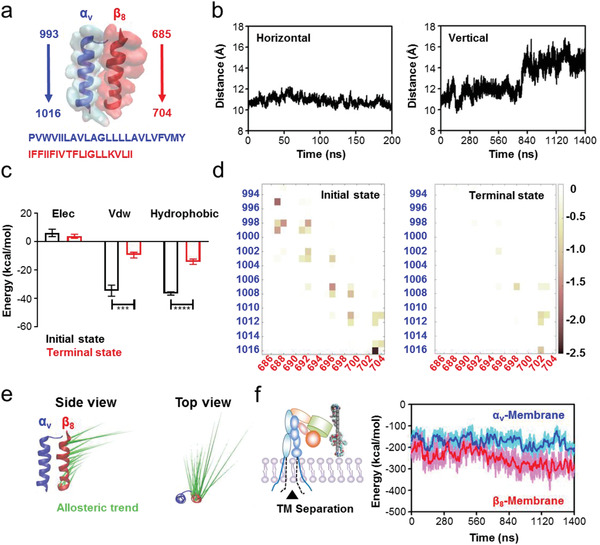
Figure 4.

Separation of α v β 8 TM domains induced by GO‐PEG‐mediated conformational transduction. a) Structural diagrams and residues of the α v β 8 TM domains. b) Centroid distance of TM domains between the α v and β 8 subunits. Left panel: horizontal mode; Right panel: vertical mode. The increased distance in the vertical mode suggests the separation of α v β 8 TM domains. c) Free energy calculation and decomposition between the α v and β 8 subunits at the initial and terminal moments in the vertical mode. Data for initial state were obtained from three representative snapshots extracted from the first 1 ns of production simulation, and data for terminal state were obtained from three representative snapshots extracted from the final 1 ns of production simulation. Data show that van der Waals (VdW) and hydrophobic interactions are the main energy barriers for TM domain separation. d) Pairwise amino acid interaction between the α v and β 8 subunits at the initial and terminal moments in the vertical mode. Data show that the pairwise amino acid interactions are rearranged, accompanied by TM domain separation. e) PCA to assess the movement tendency of α v β 8 TM domains. α v TM domain is overlapped and the movement tendency of β 8 TM domain is visual from both the side and top view. f) Noncovalent interaction energies between the POPC membrane lipids and α v or β 8 subunit TM domains. Data show that the enhanced energy between β 8 and membrane accounts for α v β 8 TM domain separation.
