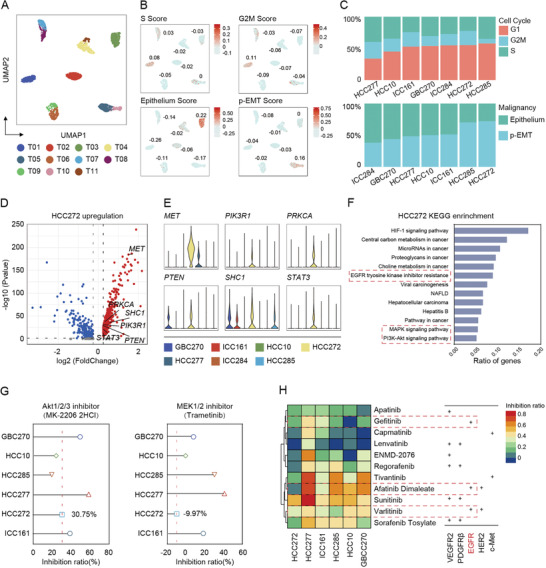
Figure 2.

Single‐cell transcriptome atlas of patient‐derived hepatobiliary tumor organoids. A) UMAP plot of all the single cells from seven patient‐derived hepatobiliary tumor organoids reveals tumor‐specific clusters. 500 cells were extracted randomly from each sample. B) UMAP plot of all the single cells colored by different score, including S Score, G2M Score, Epithelium Score, and p‐EMT Score. Related score was determined by the average expression of representative markers genes. Color key from gray to red indicates relative score levels from low to high. For scoring gene list and scoring, see Tables S5–S7 in the Supporting Information. C) The proportions of cells with different cell cycle or malignancy of each tumor organoid. D) Volcano plots of differential expression genes of HCC272. Upregulated tumoral malignancy‐related genes were labeled. E) Violin plots showing tumoral malignancy‐related genes of each tumor organoid. The width of a violin plot indicates the kernel density of the expression values. F) KEGG enrichment analysis of HCC272 participated in a wide range of cancer‐related functions. G) Forest plot depicts inhibition ratio of MK‐2206 2HCl (Akt1/2/3 inhibitor) or Trametinib (MEK1/2 inhibitor) in six organoid lines. The assessment of each drug has been independently repeated at least twice. Data were presented as mean of multiple inhibition ratios. H) Heatmap shows inhibition ratio of 11 drugs in six organoid lines. Detailed drug information is listed in Table S3 and related inhibition ratio in Table S8 in the Supporting Information. Color key from blue to red indicates relative inhibition ratio from low to high.
