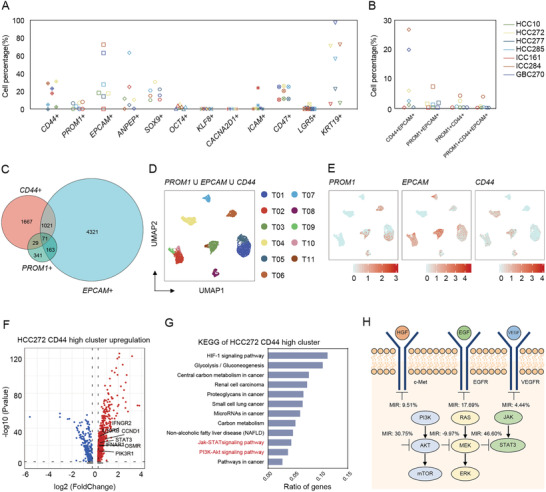
Figure 3.

Characterizing individual organoid CSCs and its heterogeneity by single‐cell RNA‐seq. A) Scatterplots showing the cell percentage (%) of representative cell surface markers (reported as a stem marker of hepatobiliary system tumors) in individual organoids. Also see Table S4 in the Supporting Information. B) Scatterplots showing the cell percentage (%) of representative double or triple cell surface marker expressing cells in individual organoids (PROM1, EPCAM, and CD44). Also see Tables S9 and S10 in the Supporting Information. C) A Venn diagram is shown of single cells that expresses the representative most common hepatobiliary CSC‐like markers (PROM1, EPCAM, and CD44). D) UMAP plot of all the single cells marked by three hepatobiliary CSC‐like markers PROM1, EPCAM, and CD44. E) Expression levels of representative liver CSC‐like marker genes in each subgroup are plotted onto the UMAP map. Color key from gray to red indicates relative expression levels from low to high. The “expression level” was normalized by “logNormalize” method in “Seurat.” F) Volcano plots of differential expression genes of HCC272 CD44 high cluster. Upregulation related genes were labeled. G) KEGG‐enrichment analysis of HCC272 CD44 high cluster. H) Simplified scheme of the signaling pathway including target of used drugs and related inhibition ratio in HCC272 organoid line.
