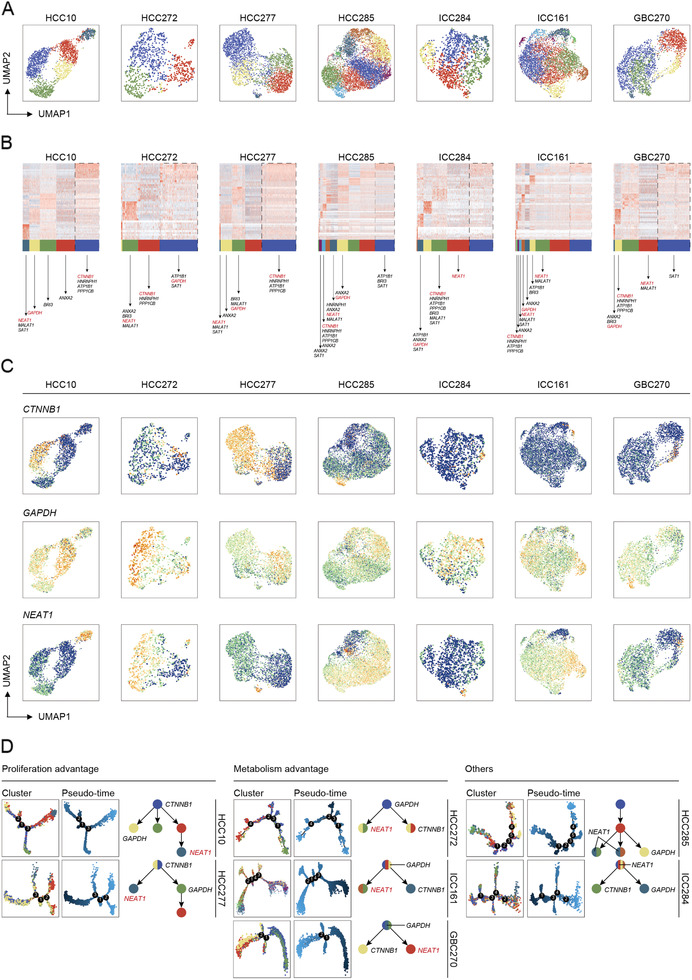
Figure 4.

Intratumoral heterogeneity and tumor evolution trajectory of patient‐derived hepatobiliary tumor organoids. A) UMAP plot of all the single cells in individual hepatobiliary tumor organoids. Also see Table S11 in the Supporting Information. B) Heatmap shows genes (rows) that are differentially expressed in seven individual organoids clusters (columns). Ten co‐expressed genes were listed and critical genes were labeled. C) UMAP plot of all the single cells marked by CTNNB1, GAPDH, and NEAT1 in each organoid. Color key from blue to yellow indicates relative expression levels from low to high. D) Single‐cell trajectory and pseudo‐time analysis of all the seven organoids defined the proliferation advantage cluster and the metabolism advantage one.
