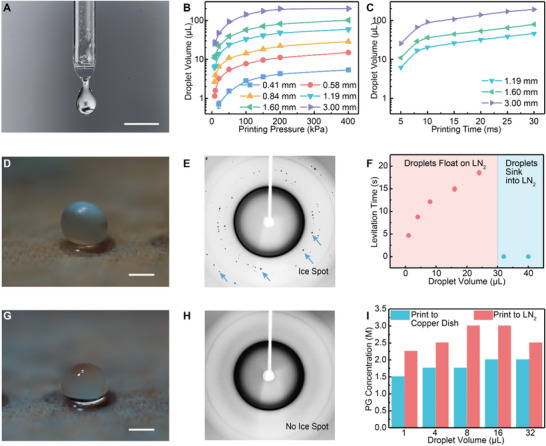
Figure 2.

Microliter CPA droplet printing and vitrification. A) Image of printed droplet next to the printing tip, captured by camera with a high‐speed flashlight. B) The effect of printing pressure and printing tip diameter on the droplet volume (n = 20). Printing time was 5 ms. C) The effect of printing time (i.e., pressure pulse duration) and printing tip diameter on the droplet volume (n = 20). Printing pressure was 8 kPa. D) Image of a crystallized droplet (4 µL) when the droplet was printed directly into LN2. E) Representative X‐ray diffraction pattern of a crystallized droplet. The dark ring represents the tubing material used to hold the droplet for measurement. F) Levitation time of droplet on the surface of LN2 increased with increasing droplet volume (n = 10). But for large droplet size (i.e., 32 and 40 µL), droplet sank directly into LN2. G) Image of a vitrified droplet (4 µL) when the droplet was printed onto a cryogenic copper dish. H) Representative X‐ray diffraction pattern of a vitrified droplet. I) Required PG concentration for vitrification using different droplet sizes and cooling methods (n = 5). In (B,C,F), data points represent mean ± s.d.. Error bars are included, but may not be visible. Scale bars are 1 mm.
