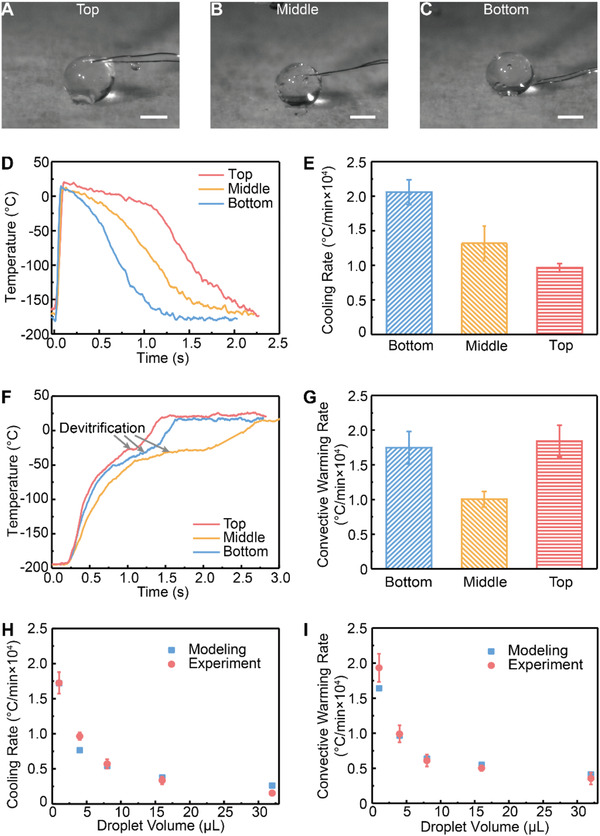
Figure 3.

Measurement and modeling of temperature change rate within the droplets. A–C) A thermocouple was placed on the cryogenic copper dish at various distances from the surface. Droplet (4 µL) was printed onto the thermocouple such that the thermocouple was located at the bottom, center, or top of the droplet. D) Representative temperature profile recorded by the thermocouple during droplet cooling. E) Cooling rates at the bottom, middle, and top of the droplets (n = 5). Temperature zone from −20 °C to −140 °C was used to calculate the cooling rate. F) With thermocouple located within the vitrified droplet, temperature profile during convective warming was recorded. G) Convective warming rates at the bottom, middle, and top of the droplets (n = 5). Temperature zone from −20 °C to −140 °C was used to calculate the warming rate. In (D–G), droplet volume is 4 µL. H) Comparison of simulated and experimental cooling rate at the top of various sized dropletc (n = 5). I) Comparison of simulated and experimental convective warming rate at the middle of various sized droplet (n = 5). Scale bars are 1 mm. Data points represent mean ± s.d..
