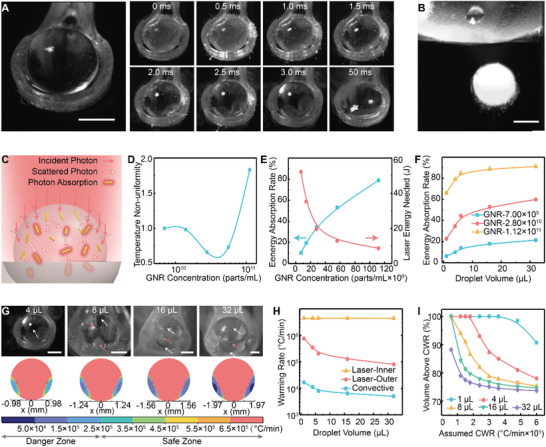
Figure 4.

Rewarming of the microliter vitrified droplet. A) Left: image of a 4 µL vitrified droplet on the cryoholder brought out of LN2. Right: after the remaining LN2 around the droplet evaporated, the sequential snapshots of the droplet during and after a 2.5 ms laser pulse. No apparent ice formation or boiling was observed during laser warming. B) A 4 µL vitrified droplet was dropped into the CPA unloading solution for convective warming. Apparent ice formation (i.e., white color) was noted. C) Schematics of Monte Carlo modeling for GNR‐induced laser warming within the droplet. D) Simulated temperature non‐uniformity (i.e., standard deviation of the temperature) of the laser warmed droplet with various GNR concentrations, normalized by GNR concentration of 7 × 10⁹ parts mL−1. E) Simulated energy absorption rate (blue), the ratio between absorbed energy by the droplet and total incoming laser energy. Measured laser energy (red) that is required to rewarm the droplet to complete melt. F) Simulated energy absorption rate in various droplet sizes with different GNR concentrations. G) Top: images of various sized droplets right after the 2.5 ms laser pulse. White arrows indicate liquid area and red arrows for ice area. Bottom: Simulated warming rate distribution within various sized droplet. Warming rate lower than 2.5 × 10⁵ °C min−1 indicates the danger zone (i.e., devitrification), higher than 2.5 × 10⁵ °C min−1 indicates the safe zone. H) Simulated average warming rates of various sized droplets using laser and convective warming methods. For laser warming, the droplet was separated into inner area (i.e., more laser access) and outer area (i.e., less laser access due to refraction). I) Simulated volume percentage of the droplet with warming rate above a certain assumed critical warming rate (CWR). Multiple droplet sizes were plotted. Scale bars are 1 mm.
