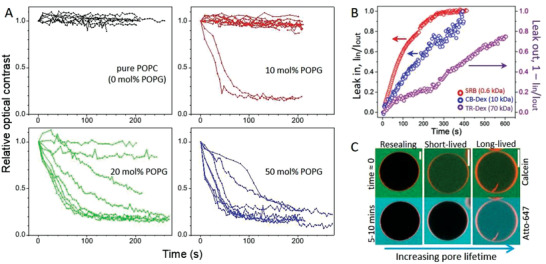
Figure 2.

Charged GUVs surviving electroporation remain in a highly permeable state after the pulse (3 kV cm−1, 150 µs). A) Time dependence of the relative contrast loss for GUVs made of POPC with increasing molar fraction of POPG. Each curve represents a measurement on a single GUV (8–10 vesicles per composition were measured). Time 0 indicates when the pulse was applied. To evaluate the contrast loss (see Figure S6, Supporting Information), data were normalized by the value obtained right after macropore closure and relaxation of the vesicle to a spherical shape (typically 50–100 ms after the pulse). B) Long term permeation of the water‐soluble dyes SRB (red) and CB‐Dex (blue) into 50 mol% POPG GUV after electroporation shown as the fluorescence intensity ratio I in /I out measured inside/outside the same vesicle. Data in purple show the slower leak out (1–I in /I out) of TR‐Dex from another GUV. C) Three types of vesicle response (membrane in red; 50 mol% POPG) illustrated with dye entry at different times after electroporation. Calcein (green) is added prior to poration (time ≈ 0, upper row) and shows the immediate dye permeation occurring in the first 1–2 min after the pulse as well as long‐term permeability. Atto‐647 (cyan, lower row) is added 5–10 min after electroporation and reports the presence of long‐lived pores only. Scale bars: 20 µm.
