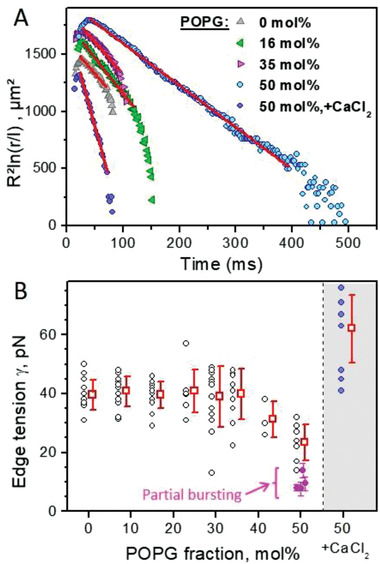
Figure 4.

Measurements of edge tension of POPC:POPG GUVs with varied surface charge and under different experimental conditions. A) Traces of pore closure dynamics in POPC GUVs with increasing fraction of POPG (R is the vesicle radius, r is pore size in µm rescaled by l = 1 µm). The data in the slow pore closure regime are fitted by a linear dependence (red line) the slope of which is used to calculate the edge tension (see text for details). Differences in the absolute values of the data represent mainly differences in GUV size. B) Edge tension values for increasing fractions of POPG (each point represents a measurement on one vesicle; a total of 97 vesicles were measured, 4 to 16 vesicles per membrane composition) in the presence of 0.1 × 10⁻³ m or 0.5 × 10⁻³ m NaCl (see also Table S2, Supporting Information). Data in the gray region correspond to measurements on POPC:POPG 1:1 GUVs in the presence of 1 × 10⁻³ m CaCl2. Data (mean and standard deviation) collected on vesicles exhibiting partial bursting is also shown (magenta), see Text S2 of the Supporting Information. The errors of the magenta data (standard deviation) originate from fitting the data using as an input the GUV sizes measured before or after electroporation, which varies significantly for vesicles that display partial bursting.
