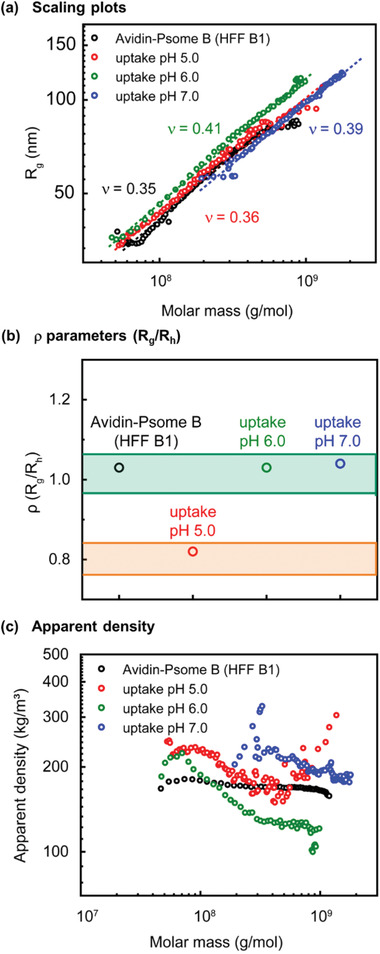
Figure 6.

Conformational properties of Avidin‐Psome B (HFF B1) (black), loaded with Biotin‐PEG3kDa at varied pH (5.0 = red; 6.0 = green, 7.0 = blue): a) scaling plots, R g versus molar masses; (b) ρ parameters (R g/R h) at concentration maximum, (ρ parameters in the grass‐green area: vesicles are soft spheres with inhomogeneous and rough surface; ρ parameters in the orange‐yellow area: vesicles are ideal, hard sphere with smooth surface), and c) apparent densities versus molar masses determined by AF4‐LS.
