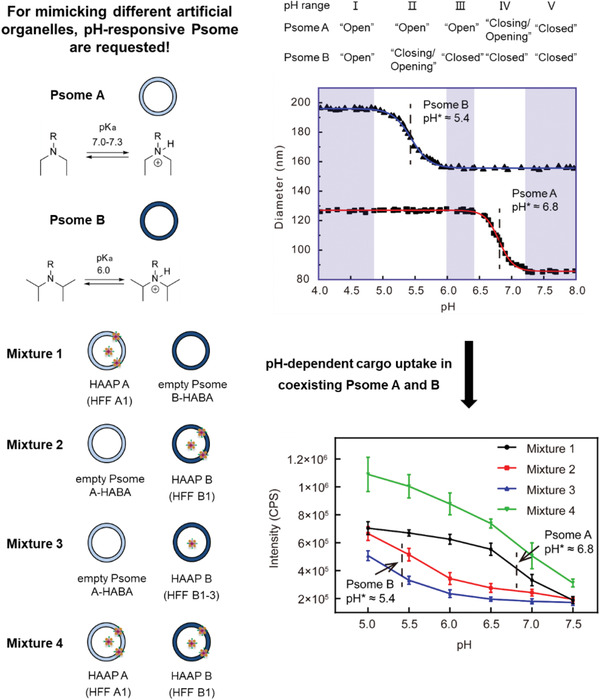
Figure 7.

The pH‐dependent “open”, “closing/opening”, or “closed” state of pH‐responsive Psome A and B demonstrating the pH‐dependent Biotin‐PEG3kDa diffusion into coexisting Psome A and B through FRET experiments. The diffusion of Biotin‐PEG3kDa is triggered by the different pH0 (starting point of swelling) and pH* (turning point of pH‐dependent size transition). DLS–titration data of Psome A and B in 1 × 10⁻³ m PBS buffer and their different pH‐dependent “open”, “closing/opening”, or “closed” state (top). The fluorescence intensity at 518 nm of Avidin–Alexa Fluor 488 conjugate in Mixture 1 (HAAP A (HFF A1) and empty Psome B–HABA mixture; HAAP A (HFF A1) through purification of AAF‐Psome A with HFF A1 and followed by the addition of HABA (Figure S16, Supporting Information)), Mixture 2 (empty Psome A‐HABA and HAAP B (HFF B1) mixture; HAAP B (HFF B1) through purification of AAF‐Psome B with HFF B1 and followed by the addition of HABA (Figure 3)), Mixture 3 (empty Psome A‐HABA and HAAP B (HFF B1‐3) mixture; HAAP B (HFF B1‐3) through purification of AAF‐Psome B with sequential HFF B1‐3 (Figure 3) and followed by the addition of HABA), and Mixture 4 (HAAP A (HFF A1) and HAAP B (HFF B1) mixture) by adding Biotin‐PEG3kDa at various pH values for carrying out FRET experiments (bottom). Mixture 5 (empty HABA‐Psome A and B mixture) as blank experiment outlines no fluorescent properties (Figure S24, Supporting Information).
