Figure 2.

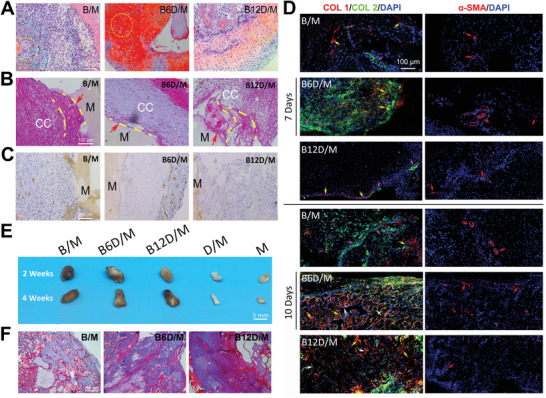
In vivo chondrogenesis, vascularization, and ossification. A) Safranin‐O‐fast green staining at 7 days. The expression of aggrecan was visualized in red (yellow circle). B) HE staining at 7 days. (Interface between implanted material and tissue: red arrow; surrounding fibrous: yellow dash lines; cartilage: CC; woven bone: WB; implanted material: M.) C) Immunohistochemistry analyses of CD31 expression at 7 days. D) Immuno‐fluorescence analysis of COL 1 (red), COL 2 (green), and α‐SMA (red) at 7 and 10 days; and nucleus stained with DAPI (blue). (COL 1: yellow arrow; COL 2: pink arrow; vascular: red arrow; mature bone: white arrow.)) E) Digital images of ectopic bones at 2 and 4 weeks. F) Masson's trichrome staining of B/M, B6D/M and B12D/M at 2 weeks.
