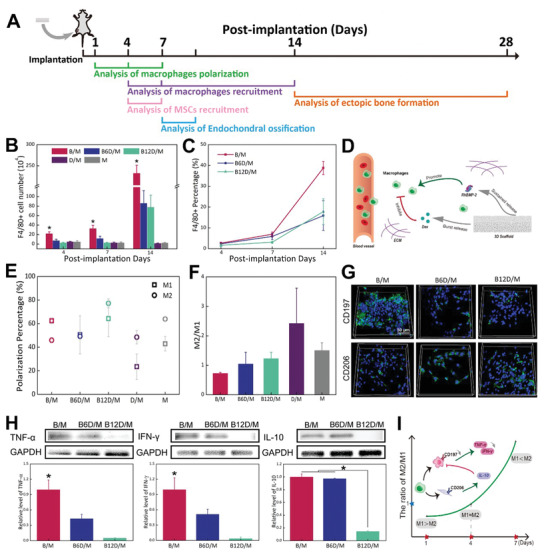
Figure 3.

Immunomodulation effect of Dex on F4/80+ monocytes and macrophages recruitment and macrophages phenotypes. A) Experimental design time flowchart. B) Quantification of F4/80+ cell number. C) Percentage of F4/80+ cells. D) Scheme of recruited macrophages to implantation. Dex inhibited macrophages recruitment from surrounding tissues and blood vessels while rhBMP‐2 promoted them. Recruited macrophages could be customized with the proper ratio of Dex and rhBMP‐2. E) Percentages of M1 phenotype and M2 phenotype of five groups at 4 days. F) Ratio of M2/M1 of B/M, B6D/M, B12D/M, D/M and M at 4 days. G) Immunofluorescence images of CD197 and CD206 expression (green), and nucleus stained with DAPI (blue). H) Protein expression of TNF‐α, IFN‐γ, and IL‐10. I) Ratio of M2/M1 in B6D/M at different time points. M1 macrophages predominated at day 1 and M2 macrophages predominated at day 7. Intriguingly, the ratio of M2/M1 approached 1 at day 4 in B6D/M, with significantly lower M1 macrophages and pro‐inflammatory cytokines than B/M. (*p < 0.05, N = 3.)
