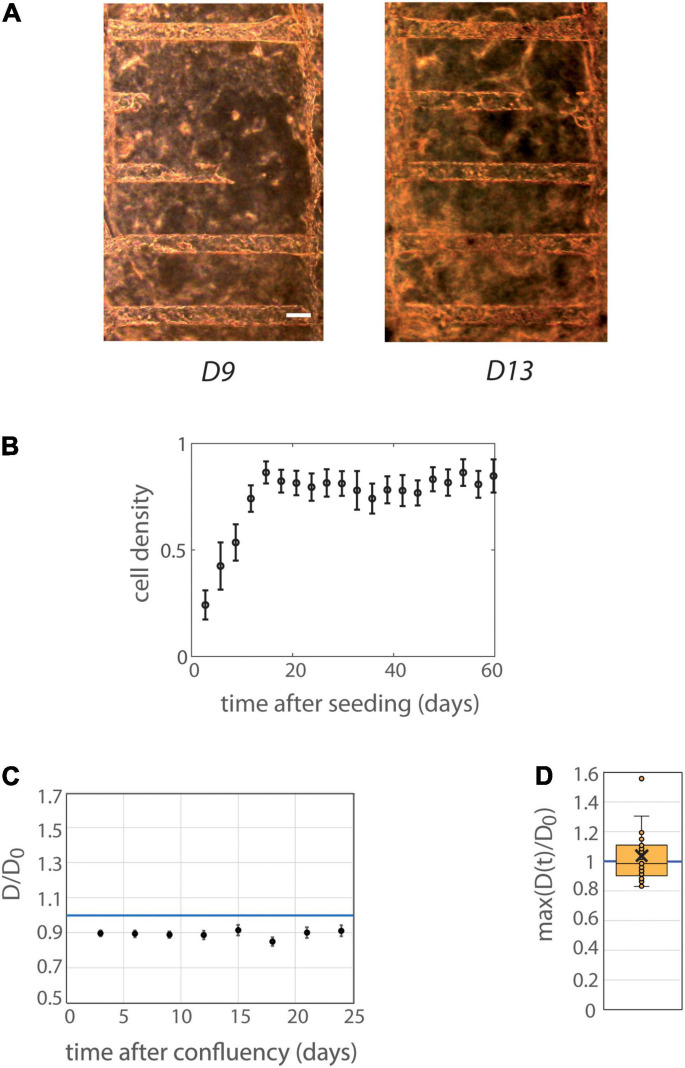
FIGURE 2.
Behavior of MDCK cells in tubes. (A) MDCK-Lifeact-GFP cells were seeded within tubes molded in collagen I at 6 mg/ml, and observed under an optical microscope over time. The temporal evolution at days 9 and 13 after seeding is represented (before and at confluency) is represented. Scale bar: 100 μm. (B) Mean cell density over time (n = 12 MDCK chips). The temporal scale refers to time after cell seeding for colonization curves. Tubes with or without laminin coating were pooled, because of similar behaviors in these two conditions (see Supplementary Figure 8 for separated behavior). The mean curve remains below cell density 1 (corresponding to full colonization) reflecting the fact that some tubes were never fully colonized with cells. Error bars: S.E.M. (C) Kinetic evolution of mean tubes diameter normalized by diameters at seeding as function of the time after tube confluency. The temporal scale refers to time after confluency for curves of tube deformation. A blue horizontal line at D/D0 = 1, corresponding to no change in diameter, is indicated. Chips with or without laminin coating were pooled. Each time point corresponds to 19–30 tubes. Error bars: S.E.M. (D) Maximum (over time) of the mean normalized diameter. Tubes with or without laminin coating were pooled. Points correspond to individual tube values. Central bar, median; cross, mean; box, values between Q1 and Q3 quartiles; error bars, extreme values [between Q1 - 1.5*(Q3 - Q1) and Q3 + 1.5*(Q3 - Q1)]. (C,D) were computed only for tubes having reached full confluency during the observation period.

