FIGURE 3.
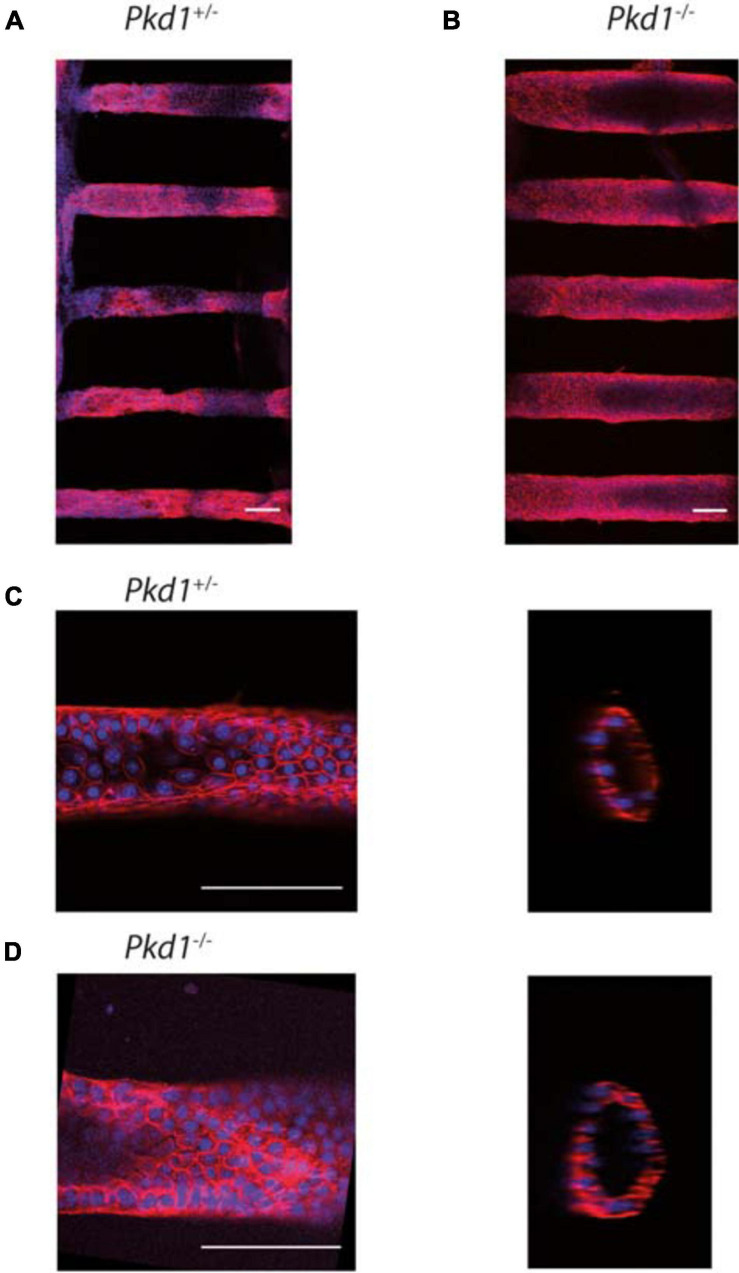
PCT Pkd1+/- and Pkd1-/- organization in tubes. Cells were labeled for F-actin and nuclei, and imaged at confocal both at low and high resolution to study the global cell organization and F-actin organization. Confocal images of tubes labeled with phalloidin-TRITC (red) and Hoechst (blue). (A,B) global organization of Pkd1+/- (A) and Pkd1-/- (B) tubes imaged at a low resolution (10× objective). Maximal z projections. Mean tube diameters of tubes in the chips shown, as assessed by z projection, were, respectively, ∼85 and 135 μm for the chips shown in (A,B), in agreement with Pkd1-/- tube deformation. (C,D) Pkd1+/- (C) and Pkd1-/- (D) tubes imaged at a high resolution (40× objective) in steps corresponding to the first early steps of tube dilation for Pkd1-/- cells. Confocal section (left) and orthogonal projection (right). A median filter (3 pixels) was applied on orthogonal projection images. Scale bar, 100 μm. Mean diameters measured for tubes imaged at high resolution were 85 ± 10 μm for the Pkd1+/- condition and 95 ± 5 μm for the Pkd1-/- condition for high resolution images (S.D. are indicated). Here 24 images of Pkd1+/- tubes and 10 images of Pkd1-/- tubes were done (performed, respectively, on 8 and 7 chips).

