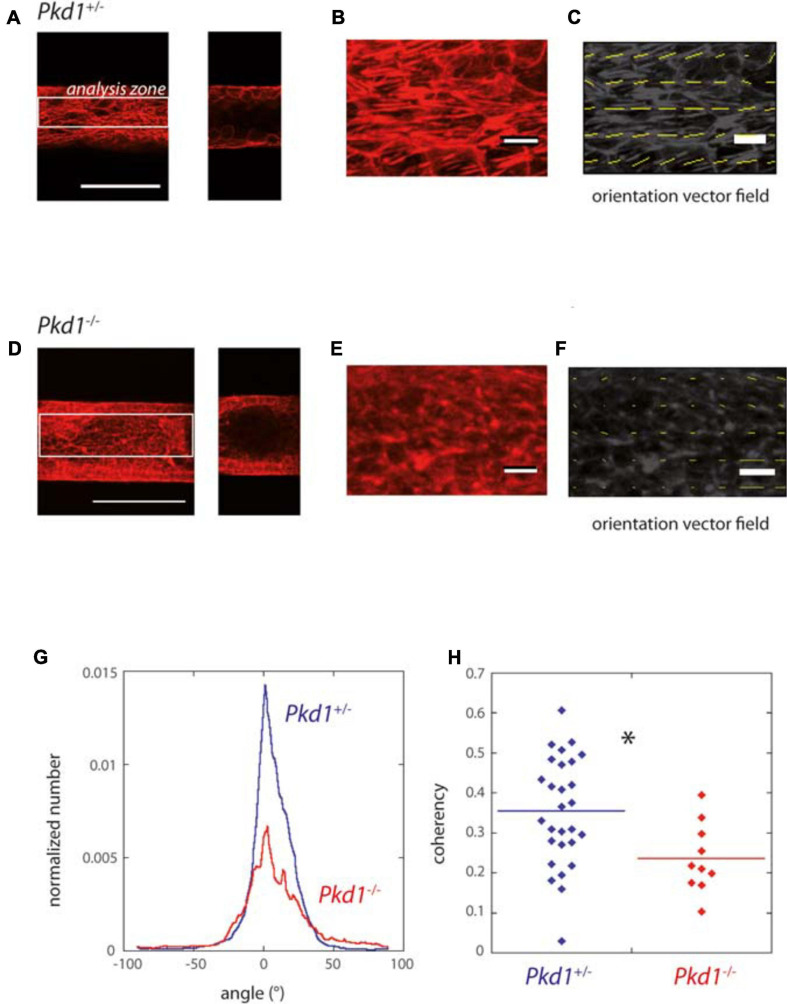
FIGURE 4.
F-actin orientation of PCT Pkd1+/- and Pkd1-/- cells in tubes. (A–F) F-actin labeling in Pkd1+/- (A–C) and Pkd1-/- (D–F) tubes. (A,D) Left: z projection of the inferior half of the tube is shown, scale bar 100 μm. Right, confocal section at the middle of the tube. OrientationJ analysis was performed in a central rectangle corresponding to half of the tube (white rectangle in A,D), in order to get rid of border effects. (B,E) Zoomed part, (C,F) Orientation vector fields (yellow arrows). Magnitude normalized by the strength of orientation (coherency) is represented. Coherency is low in the Pkd1-/- condition, so that arrows are barely visible in (F). (G) Distribution of F-actin local orientation as assessed by OrientationJ software for PCT Pkd1+/- (blue) and Pkd1-/- (red) cells. The analysis was done at a subcellular scale, with a 2 μm local analysis window. Histograms given by OrientationJ are pondered by coherency, meaning that the angle determined for a given window has a more important contribution if there is a clear-cut local orientation. Each histogram is normalized by the size of the analyzed area (in pixels2) before averaging. The analysis was performed on pooled coating conditions (laminin, ECM and collagen), with the majority of tubes corresponding to laminin coating in Pkd1-/- and Pkd+/- conditions. (H) Mean coherency (per pixel) for PCT Pkd1+/- (blue) and Pkd1-/- (red) cells. ∗Statistically significant difference with p < 0.05. Each point corresponds to one image.

