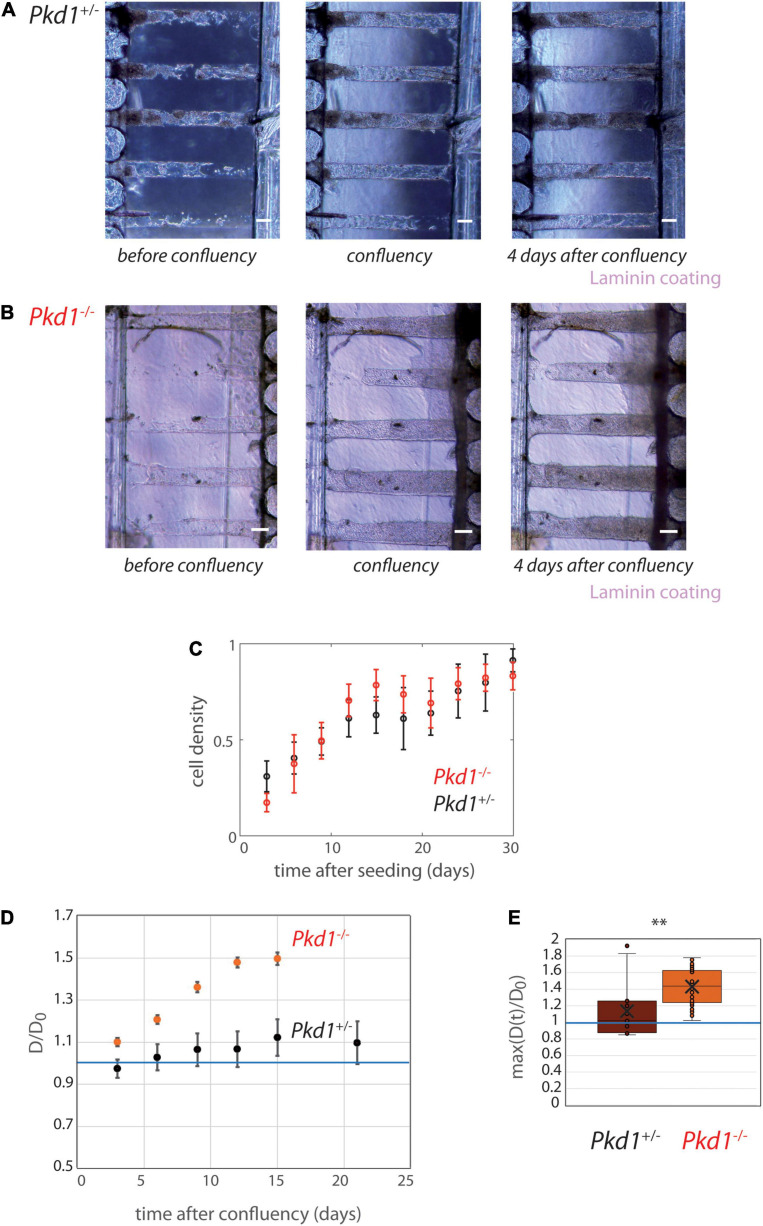
FIGURE 5.
PCT Pkd1+/- and Pkd1-/- tube deformation in chips with 200 μm spacing. (A,B) Examples of temporal evolution of tubes with laminin coating, for Pkd1+/- cells (A) and Pkd1-/- cells (B). Scale bar:100 μm. Days after seeding: (A) 11, 16 (confluency), 20, (B) 9, 10 (confluency), 14. (C–E) Quantitative analysis, n = 12 Pkd1+/- chips (black) and n = 14 Pkd1-/- chips (red), all coatings pooled (see Supplementary Figure 8 for separated behavior). (C) Mean cell density over time. Error bars: S.E.M. (D) Kinetic evolution of mean tubes diameter normalized by diameters at seeding, in function of the time after tube confluency. A blue horizontal line at D/D0 = 1, corresponding to no change in diameter, is indicated. Each time point corresponds to 8–35 tubes for Pkd1-/-, 9–20 tubes for Pkd1+/-. Error bars: S.E.M. (E) Maximum (over time) of the mean normalized diameter. Points correspond to individual tube values. Central bar, median; cross, mean; box, values between Q1 and Q3 quartiles; error bars, extreme values [between Q1 - 1.5*(Q3 - Q1) and Q3 + 1.5*(Q3 - Q1)]. (D,E) were computed only for tubes having reached full confluency during the observation period. ∗∗ indicates statistically significant difference with p = 0.0002.

