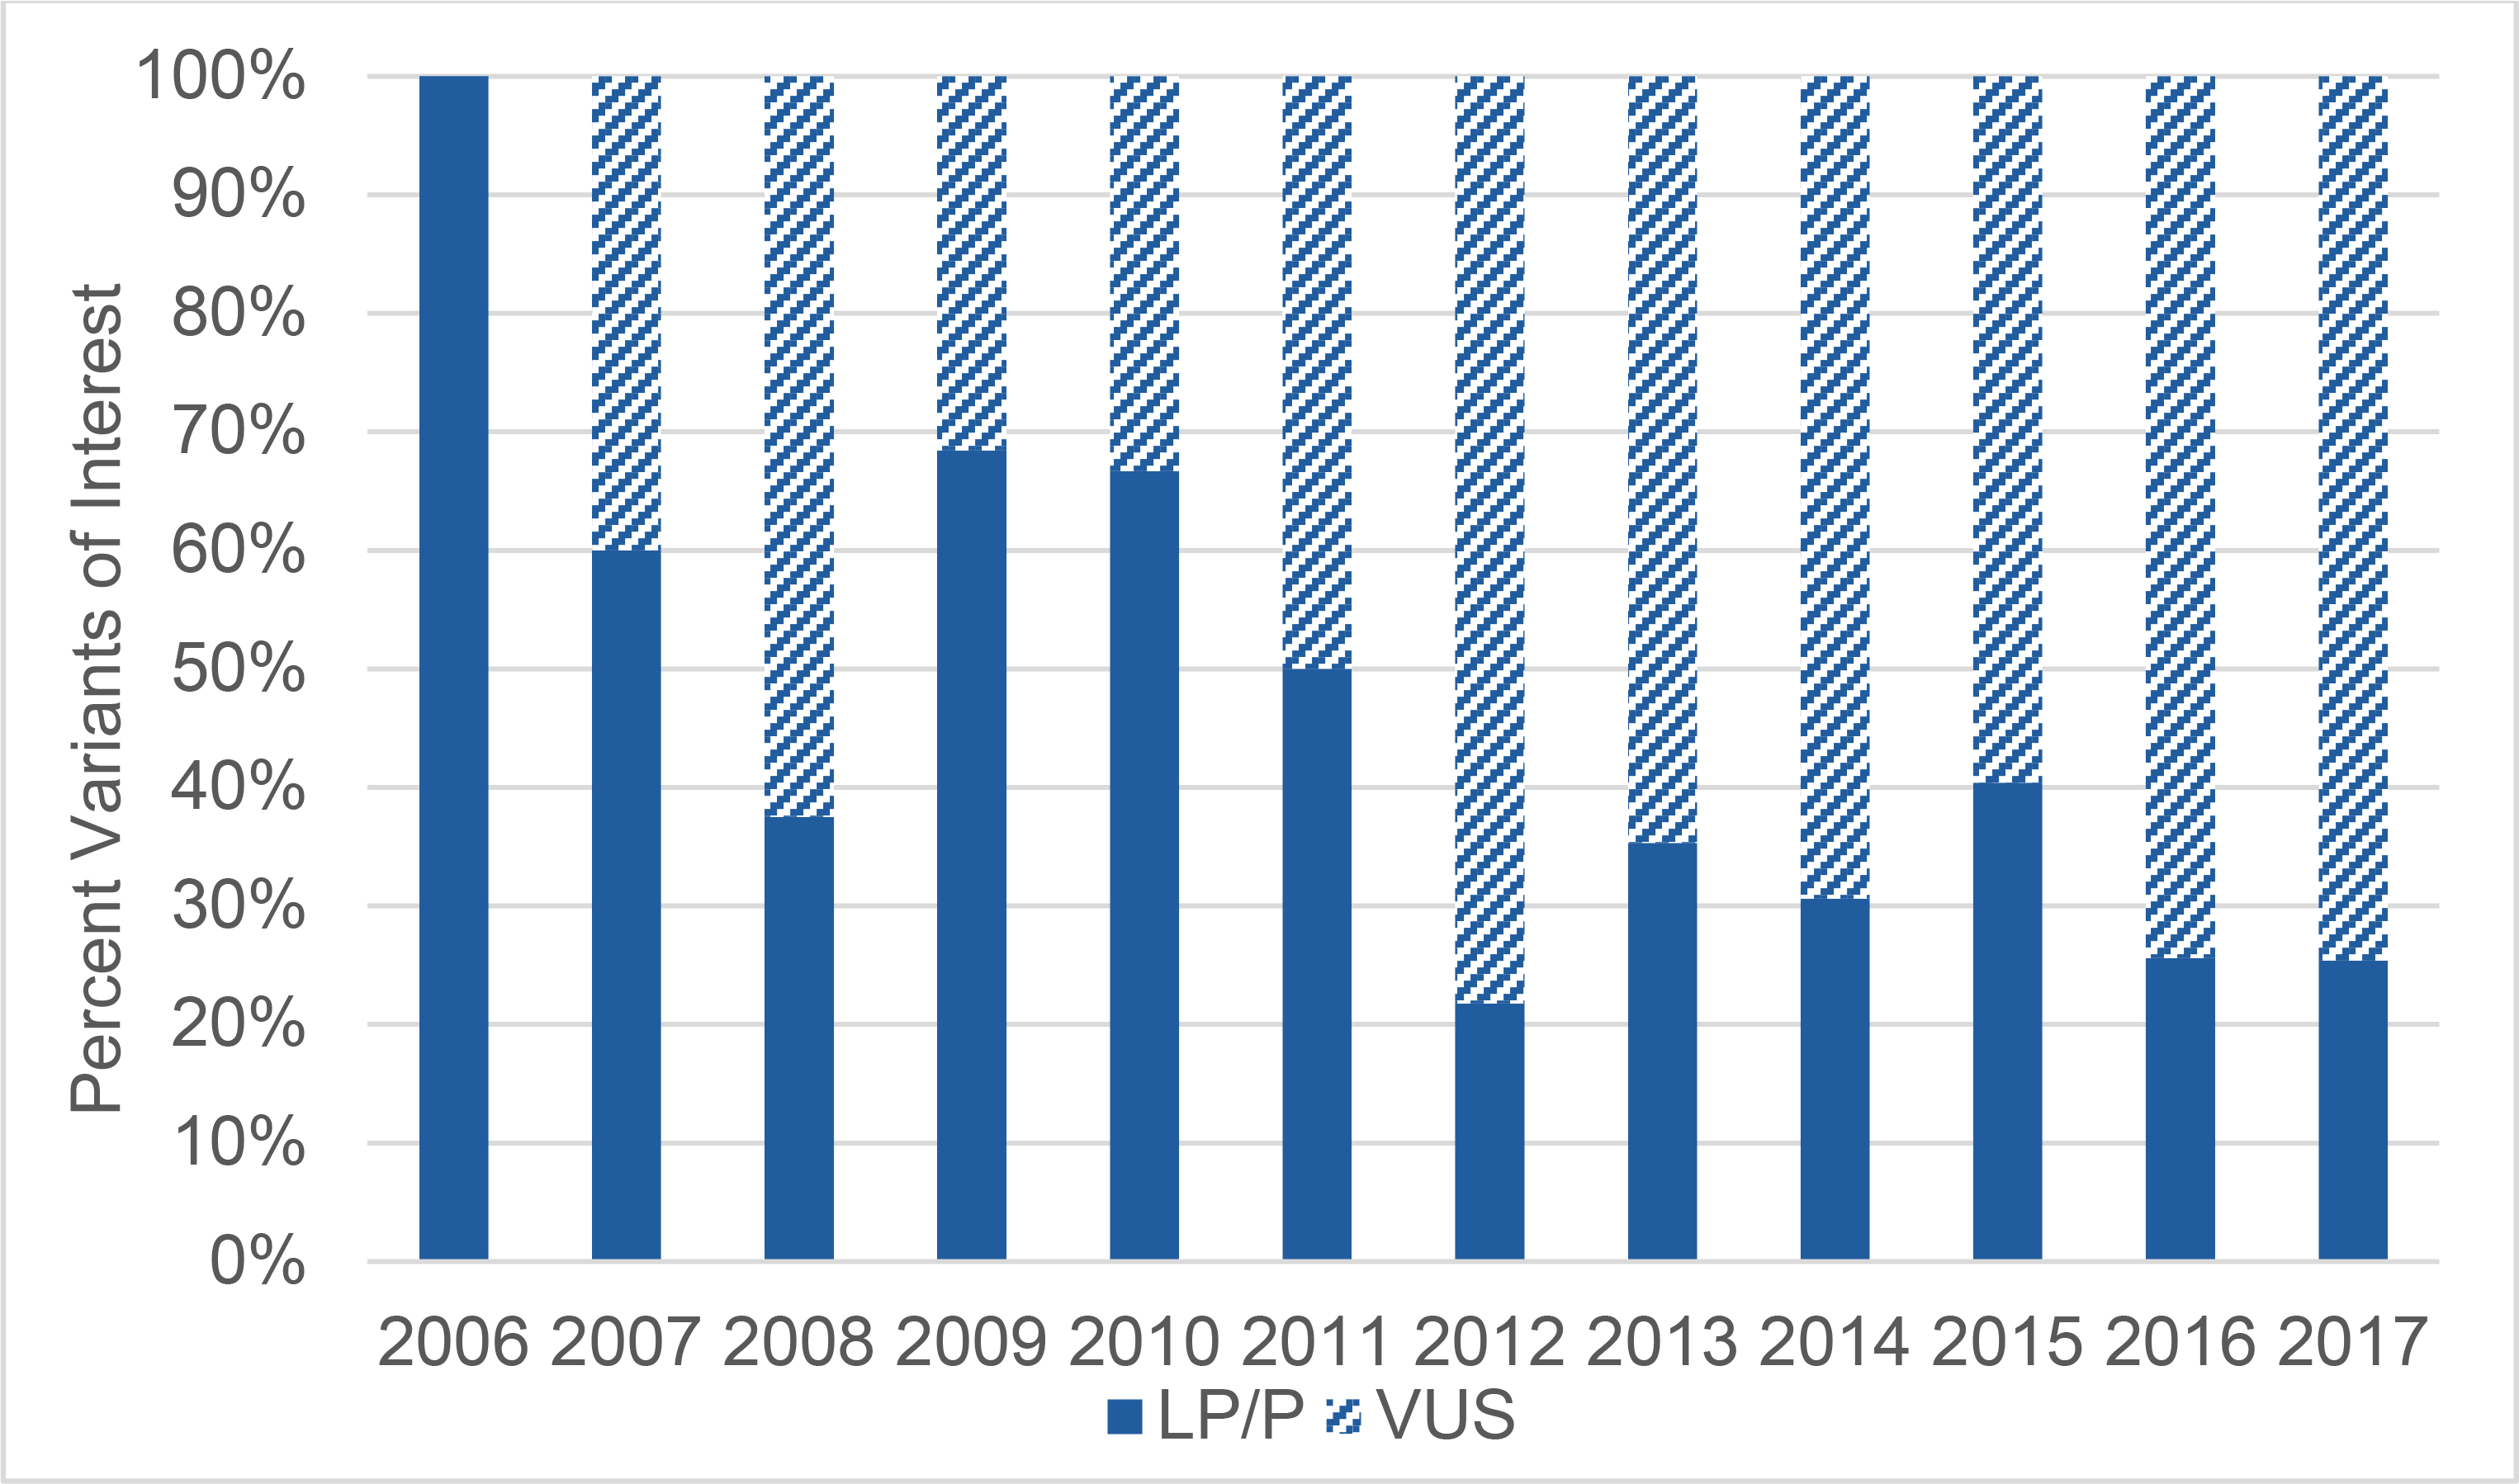
Figure II. Proportion of Variant Classification Over Time.

The total variants of interest in each year are normalized to 100%. The percentage of LP/P is shown in dark blue. Over time, there was a weak negative correlation between year of test and percentage of LP/P variants reported (Spearman correlation, r=−0.2, p=0.0045). LP/P: Likely pathogenic/pathogenic variants; VUS: Variants of uncertain significance
