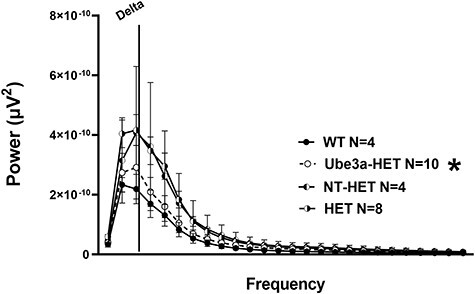
Figure 6 .

Delta power analysis in AS mice transplanted with Ube3a lentivector transduced HSPC: A PSD between using treated and untreated Ube3a-deficient IL2rg−/y mice that were irradiated and transplanted as neonates with either NT HET (semi-filled left) or the Ube3a lentivector transduced Ube3a-HET (black dotted line open circles) human CD34+ HSPC. AS mice on B6 background versus their WT background littermates illustrate observable differences in elevated delta power analogous to clinical phenotypes. Quantification of spectral power bands illustrates that treatment lowers/corrects the elevated delta spectral power toward the levels observed in WT mice.
