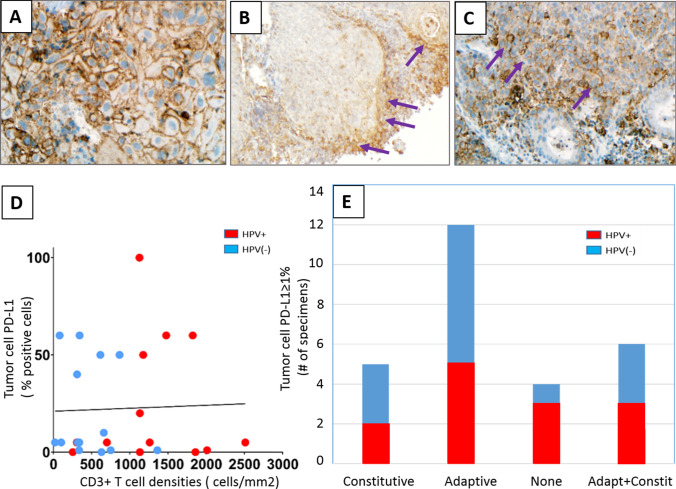
Fig. 1.
Patterns of PD-L1 expression in HNSCC. Representative examples of a constitutive adaptive, b adaptive, and c combined constitutive and adaptive (mixed) patterns of tumor cell PD-L1 expression are shown. PD-L1 staining is marked by brown chromogen. Purple arrows mark areas of adaptive tumor cell PD-L1 expression at the interface with infiltrating lymphocytes. d There was no significant correlation between tumor cell PD-L1 expression and infiltrating CD3+ T cell densities (r = − 0.0358, P = 0.86) or PD-L1 CPS and CD3+ cell densities (r = 0.21, P = 0.29, see Supplementary Fig. 1 for CPS figure), consistent with the finding of constitutive tumor cell PD-L1 expression in many cases. e Distinct patterns of tumor cell PD-L1 expression in HNSCC specimens did not correlate with tumor viral status. 400×, 100×, and 200×, original magnifications for panels a, b, and c, respectively

