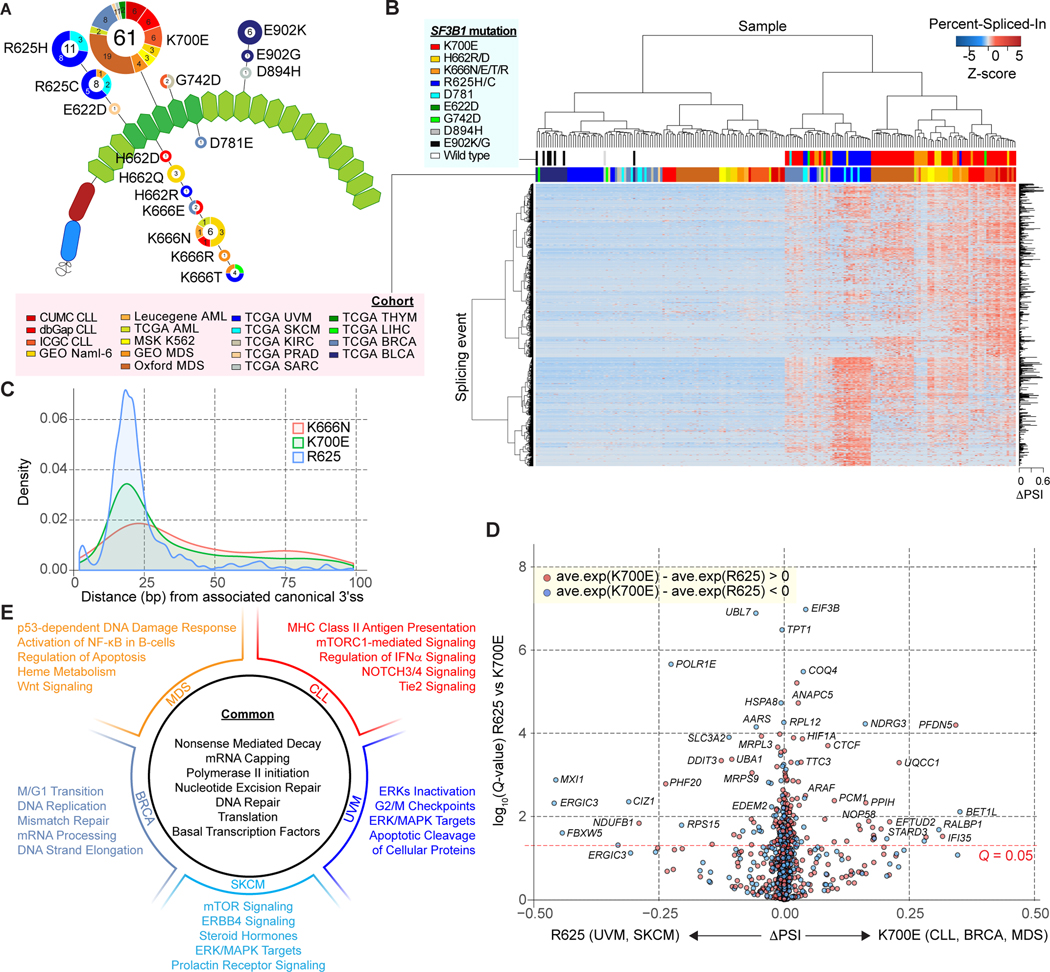
Figure 1.
Differential aberrant splicing events across SF3B1 mutant cancers. A, Location and frequency of SF3B1 hotspot mutations from the pan-cancer dataset on the HEAT repeat domains (green hexagons) of SF3B1. The numbers in the center/on the edge of each circle denote the sample size of each mutation across all/specific to each cohort (see Supplementary tables for abbreviations). B, Hierarchical clustering and heatmap analysis of differential 3’ splice sites (3’ss) between SF3B1 mutant and wild-type (WT) samples. Rows and columns represent cryptic 3’ss events and samples, respectively. 1,401 cryptic 3’ss identified from the Pan-cancer dataset are shown. Z-score in the matrix represents normalized Percent-Spliced-In (PSI). C, Density plot of distance in base pairs from associated canonical 3’ss to cryptic 3’ss. D, Volcano plot representation of differentially spliced changes between SF3B1K700E mutations (CLL, BRCA and MDS) and SF3B1R625 mutations (UVM and SKCM) showing the magnitude (difference of PSI; x-axis) and significance (-log10(q-value); y-axis). E, Representative gene sets significantly enriched in gene set enrichment analysis (GSEA) comparing all SF3B1 mutant and WT samples, as well as the results from comparisons done within each cancer type.

