Figure 3.
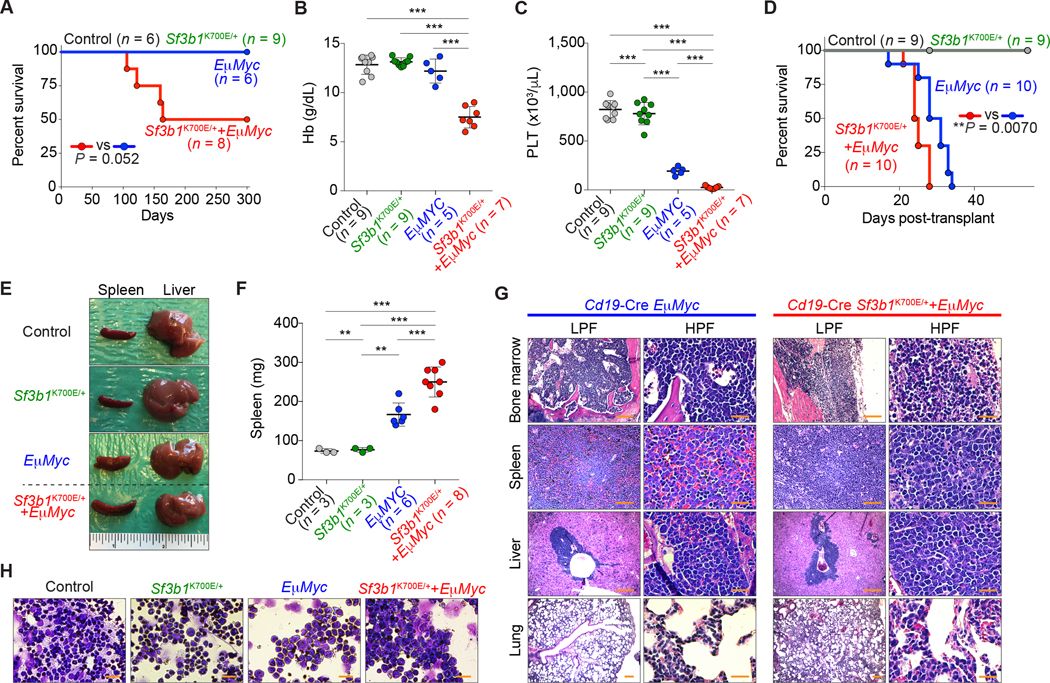
SF3B1 mutations promote c-Myc-driven lymphomagenesis. A and D, Kaplan-Meier curves of survival of primary (A) and recipient (D) mice transplanted with bone marrow (BM) cells from mice with indicated genotype (Log-rank (Mantel-Cox) test). B and C, Hemoglobin (Hb) (B) and platelet (PLT) (C) counts of recipient mice at day 28 post-transplant (the mean value ± SD is shown). E and F, Representative pictures of spleen and liver of recipient mice (E) (an inch ruler is shown together) and spleen weights of recipient mice (F) at day 28 (Cd19-Cre+/− control and Cd19-Cre+/− Sf3b1K700E/+ mice were sacrificed for comparison; the mean value ± SD is shown). G, Hematoxylin and eosin (H&E) of tissues from representative moribund primary mice (scale bar 200 μm: Low power field (LPF); 50 μm: High power field (HPF)). H, Representative cytomorphology of BM mononuclear cells of recipient mice (scale bar 20 μm). **P < 0.01; ***P < 0.001.

