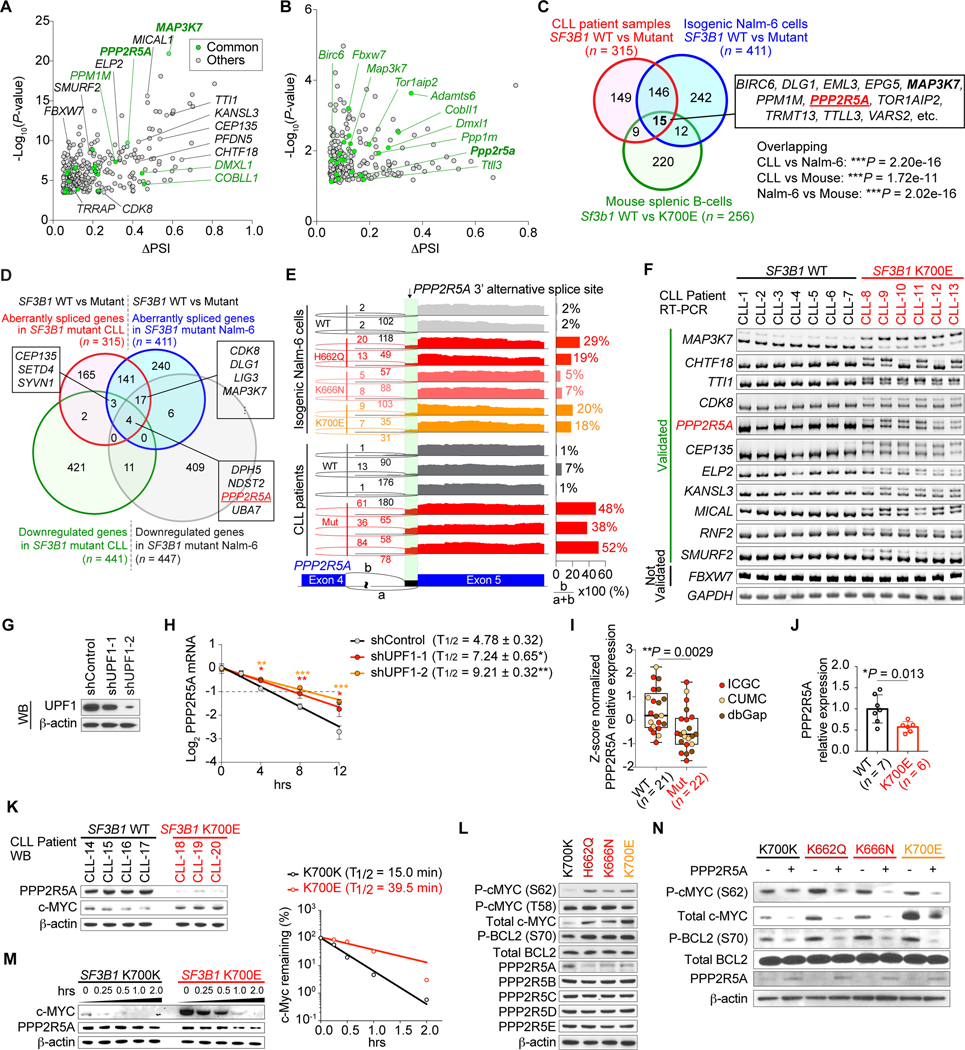
Figure 4.
Aberrant splicing of PPP2R5A leads to c-MYC activation via post-translational regulation. A and B, (Half-) Volcano plot showing alternative 3’ss events in SF3B1 mutant CLL (A) and mouse Sf3b1K700E splenic B-cells (B). Genes highlighted in green represent genes that are mis-spliced in both human SF3B1 mutant CLL and mouse Sf3b1K700E splenic B-cells. C, Venn diagram of numbers of differentially spliced genes in indicated datasets (Fisher’s exact, test). D, Venn diagram of numbers of differentially spliced and down-regulated genes in SF3B1 mutant CLL and Nalm-6 samples. E, Sashimi plots of PPP2R5A 3’ss in isogenic Nalm-6 cells (top) and representative CLL samples (bottom) with or without SF3B1 mutations. F, Representative RT-PCR results of aberrantly spliced transcripts in BM samples from CLL patients with or without SF3B1 mutations. G, Western blot (WB) analysis of Nalm-6 SF3B1K700E knock-in cells transduced with shRNAs against UPF1 (representative results from three biologically independent experiments with similar results). H, Half-life of PPP2R5A transcripts with alternative 3’ss were measured by qPCR (n = 3; the mean value ± SD is shown; P-values* compared to shControl). I, Boxplot of PPP2R5A expression from CLL patients with or without SF3B1 mutations based on RNA-seq data (sources indicated with different colors; the mean value ± SD is shown). J and K, Quantitative real-time PCR (J) and WB (K) analysis of primary CLL patient samples with or without SF3B1 mutations (the mean value ± SD is shown). L and N, WB analysis of protein lysates from isogenic Nalm-6 cells (representative results from three independent experiments are shown). M, Isogenic Nalm-6 cells were treated with 100 μg/mL cycloheximide (CHX) and cell lysates were prepared at the indicated time points after treatment. The amount of c-MYC protein at each time point (left) was quantified using ImageJ and protein half-life was calculated using Prism 7 (right). *P < 0.05; ** P < 0.01; *** P < 0.001.

