Figure 5.
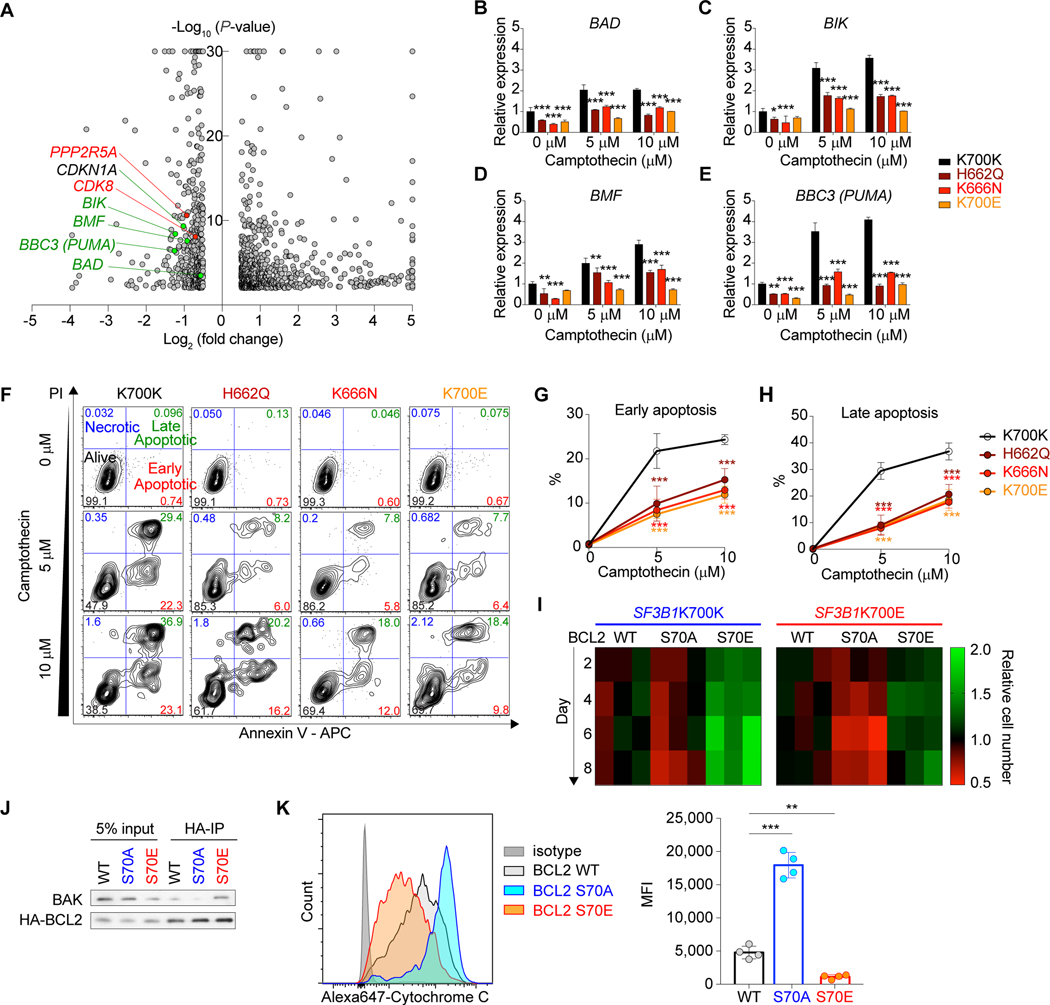
Impaired apoptosis in SF3B1 mutant cells linked to increased BCL2 S70 phosphorylation. A, Volcano plot showing differentially expressed genes in isogenic SF3B1 mutant Nalm-6 cells (|Log2 (Fold change) | = 0.5 and -log10(P-value) = 2 are used as thresholds; genes with |x| > 5 and/or y > 30 are shown on |x| = 5 or y = 30). B-E, qPCR of BAD (B), BIK (C), BMF (D), and BBC3 (PUMA) (E) in isogenic Nalm-6 cells upon treatment with camptothecin at indicated concentrations for 5 hrs (n = 3; the mean value ± SD is shown; P-values are shown for comparisons of K700K versus each mutant). F, Representative flow cytometry analysis of isogenic Nalm-6 cells upon treatment with camptothecin for 5 hrs. G and H, Percentages of cells in early (Annexin V+ PI-; top) (G) and late (Annexin V+ PI-; bottom) (H) apoptotic phases with different concentrations of camptothecin (n = 3; the mean value ± SD is shown; P-values are shown for comparisons of K700K versus each mutant). I, Heatmap was made using Prism 7 based on the cell growth upon camptothecin treatment at 1 μM (n = 3; scale represents the relative cell number at each day relative to BCL2 WT expressing cells). J, Parental Nalm-6 cells were transduced with either WT, S70A, or S70E BCL2 (all HA-tagged), treated with 5 μM camptothecin for 5 hrs, and protein lysates were immunoprecipitated with an HA antibody. Eluted protein (95% was used for BAK blotting and 5% was used for HA blotting) as well as 5% input protein were analyzed by WB. K, Isogenic Nalm-6 cells from J were treated with 5 μM camptothecin for 5 hrs and cytochrome C release was evaluated by intracellular flow cytometry staining (left; representative flow cytometry analysis from four independent experiments; Mean fluorescence intensity (MFI) is provided on the right; n = 4; the mean ± SD). *P < 0.05; **P < 0.01; ***P < 0.001.

