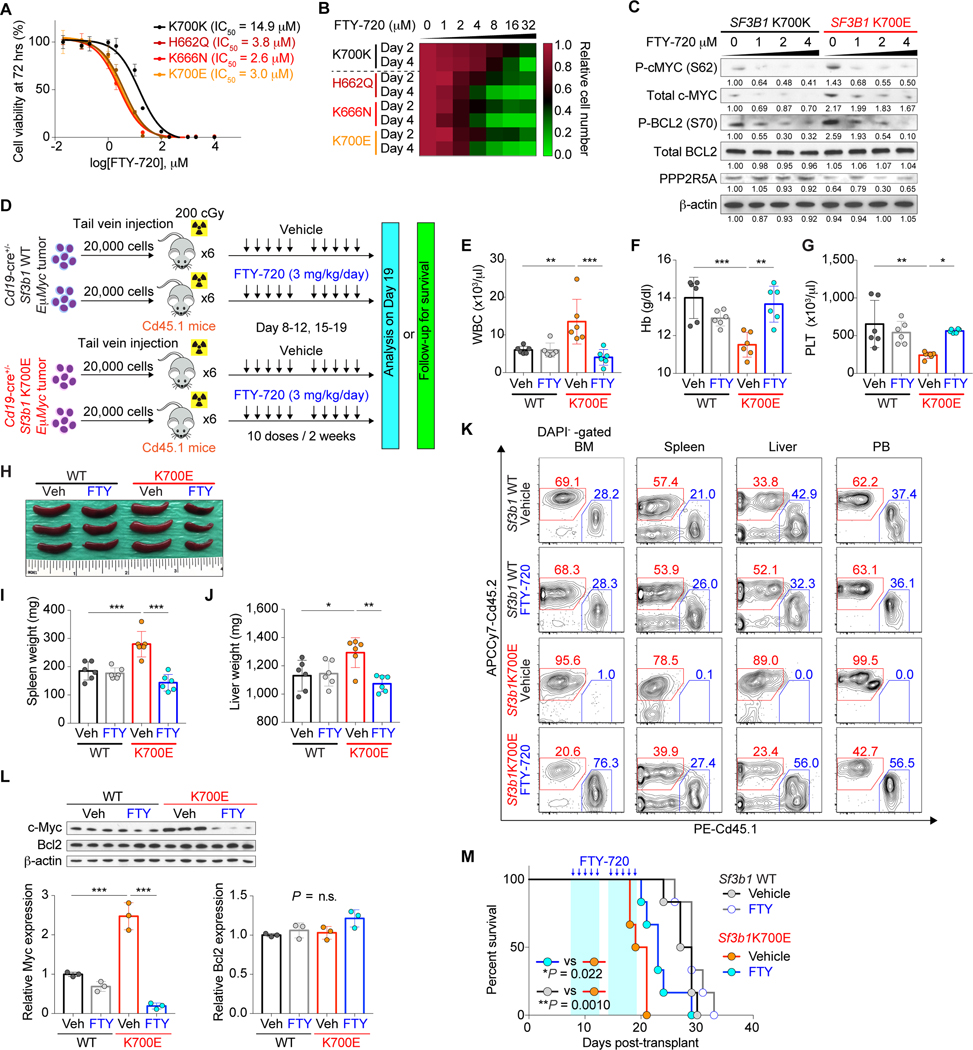
Figure 7.
Preferential sensitivity of SF3B1 mutant cells to PP2A reactivation. A, Dose response curves of isogenic Nalm-6 cells to FTY-720 (n = 3; the mean value ± SD is shown). IC50 value for each genotype is indicated. B, Heatmap was made using Prism 7 based on the cell growth upon FTY-720 treatment with increasing doses (n = 3; scale represents the relative cell number at each dose of FTY-720 relative to vehicle-treated cells with 2 or 4 days of FTY-720 treatment). C, WB analysis of protein lysates from isogenic Nalm-6 cells treated with FTY-720 at various concentrations for 24 hrs (representative results from three independent experiments are shown). D, Schematic representation of the study design. E-G, WBC (E), Hb (F), and PLT (G) counts of mice (n = 6 per genotype; the mean value ± SD is shown). H-J, Representative photo of spleens (H) and weight of spleen (I) and liver (J) in recipients (n = 6 per genotype; the mean value ± SD is shown; an inch ruler is shown together). K, Representative flow cytometry analysis of Cd45.2+ DAPI- cells in BM, spleen, liver, and PB (quantification of %Cd45.2+ DAPI- cells is shown in Supplementary Fig. S12C–S12F). L, Cd45.2+B220+ splenic cells from D at day 19 were FACS-sorted and analyzed (top; 3 mice per group; n = 1 experiment). The amount of Myc and Bcl2 protein was quantified using ImageJ (bottom; the mean value ± SD). M, Kaplan-Meier curves of survival of recipient mice treated with either vehicle or FTY-720 (n = 5 per genotype; treatment period is marked in light blue; Log-rank (Mantel-Cox) test). *P < 0.05; **P < 0.01; ***P < 0.001.

