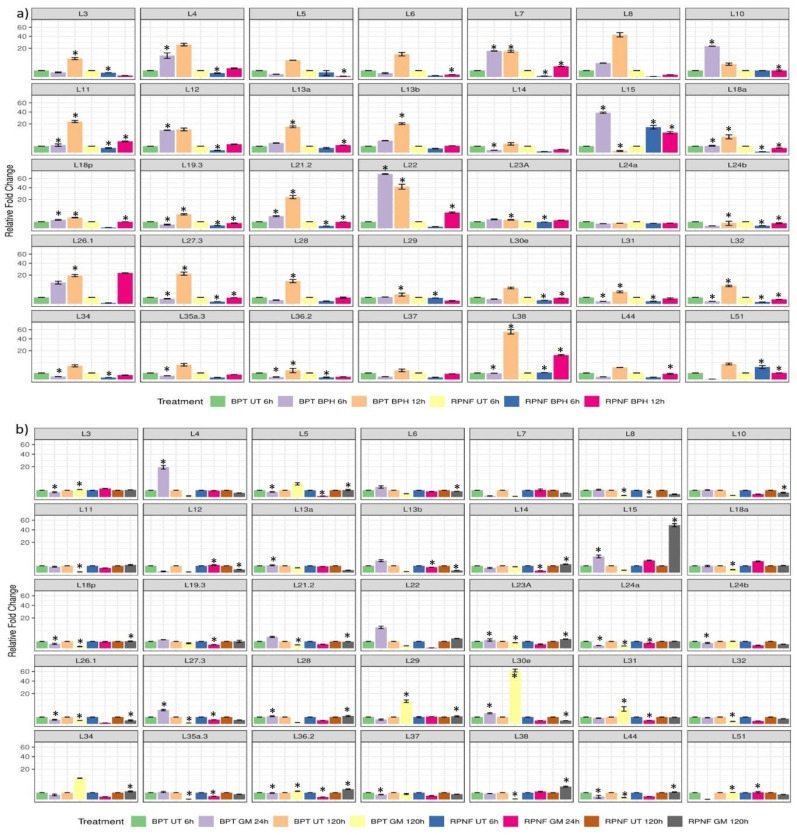
Fig. (2).
Graphical representation of the differential transcriptional response of individual RPL genes. To understand the transcript patterns of individual RPL genes upon infestation with (a) BPH and (b) GM pests, bar diagrams were constructed for each RPL gene separately. The data on the y-axis is the relative fold change calculated using the ΔΔCT method, whereas treatments are indicated on the x-axis. The asterisks in bar diagrams represent statistical significance at P < 0.05 obtained after adjusting probability values of two-way ANOVA with Bonferroni correction. Different colored grids at the bottom of each figure correspond to the type of treatment. Bar diagrams were generated using statistical program R v.3.6.3, two-way ANOVA was calculated in SigmaPlot v.11 and p values were adjusted in Microsoft excel v.2013. *UT, untreated; BPH, brown planthopper; GM, gall midge. (A higher resolution / colour version of this figure is available in the electronic copy of the article).

