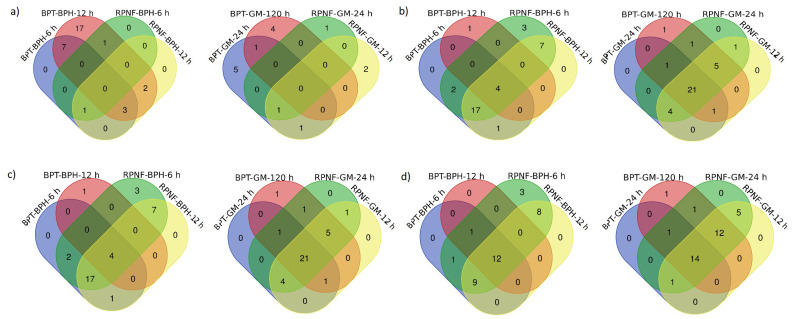
Fig. (5).
Venn diagrams representing the inducible up and downregulation of RP genes. The Venn diagrams were used to depict the total number of commonly (a) up and (b) downregulated RPL and (c) up and (d) downregulated RPS genes at 6 and 12 h after BPH and 24 and 120 h of GM infestation in BPT5204 and RPNF05 genotypes of rice. *BPH, brown planthopper; GM, gall midge. (A higher resolution / colour version of this figure is available in the electronic copy of the article).

