. 2021 Apr 29;12(22):7866–7881. doi: 10.1039/d0sc06805e

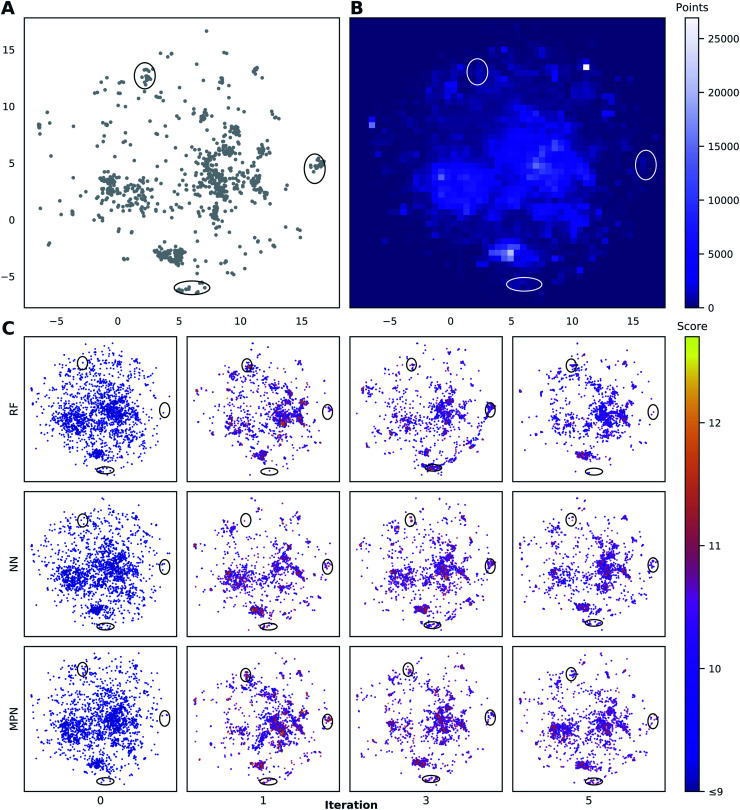
Fig. 8. Visualization of the chemical space in the Enamine HTS library (2.1M molecules) using UMAP embeddings of 2048-bit atom-pair fingerprints trained on a random 10% subset of the full library. (A) Embedded fingerprints of the top-1000 scoring molecules. (B) 2-D density plot of the embedded fingerprints of the full library. (C) Embedded fingerprints of the molecules acquired in the given iteration using a greedy acquisition metric, 0.1% batch size, and specified surrogate model architecture z-ordered by docking score. Circled regions indicate clusters of high-scoring compounds in sparse regions of chemical space. Color scale corresponds to the negative docking score (higher is better). x- and y-axes are the first and second components of the 2D UMAP embedding and range from −7.5 to 17.5.

Fig. 8