. 2021 May 7;12(22):7839–7847. doi: 10.1039/d1sc01360b

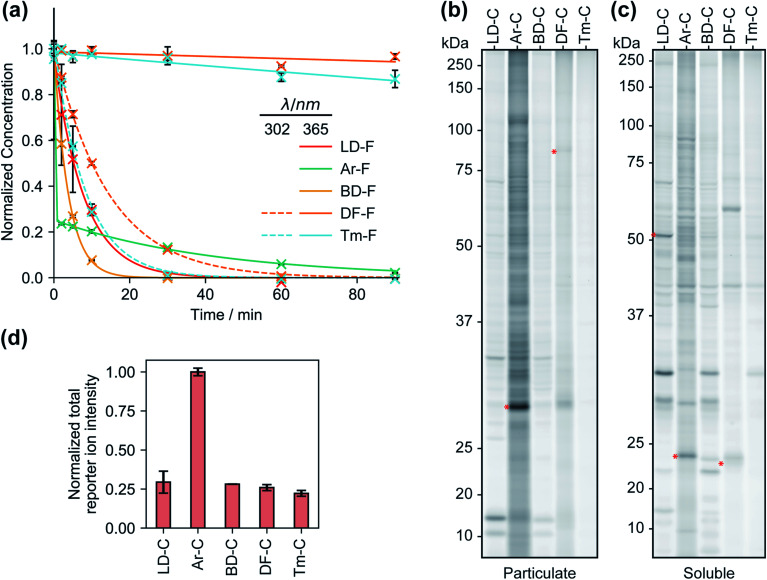
Fig. 2. The kinetics of probe photoactivation and profiles of control probes C1–5. (a) The decomposition of the fragment-based (‘F’) probes upon irradiation with UV light was followed by LC-MS. Tags LD, Ar, and BD are photoactivated at 365 nm, while probes DF and Tm require irradiation at 302 nm. Data represents average values ± SD; n = 3. (b) Gel-based profiling of control probes (20 μM) in human cells. HEK293T cells were treated with control probes (20 μM) photocrosslinked and lysed, and proteomes were conjugated to an azide-rhodamine tag and analyzed by SDS-PAGE and in-gel fluorescent scanning. Shown are probe-labeled particulate (membrane) (b) and soluble (c) fractions. (d) Relative TMT reporter ion intensity for each control probe (20 μM) in HEK293T cells. Error bars represent standard deviations from two replicates.

Fig. 2