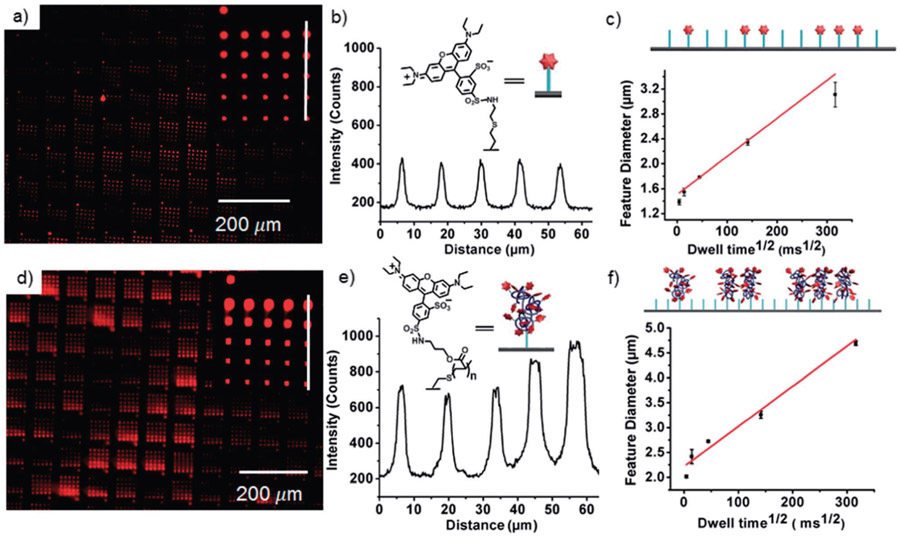
Fig. 2.
(a) Fluorescence microscopy image (Nikon Eclipse Ti, λex = 532–587 nm, λem = 608–687 nm) of an array of 2 patterned by PPL on an alkene-terminated glass slide with dwell times of 50, 500, 5000, 50 000 and 100 000 ms. Inset shows the pattern prepared by a single tip. (b) Fluorescence intensity of the printed features. The x-axis corresponds to the white line from bottom to top in (a). (c) The relationship between the square root of dwell time and feature diameter during patterning of 2 by PPL. The cartoon represents the increasing feature size as a function of dwell time from left to right. Feature diameter has an average variation of 3%. (d) Fluorescence microscopy image (10×, λex = 532–587 nm, λem = 608–687 nm) of an array of 2 patterned by PPL on a thiol-terminated glass slide with dwell times of 50, 500, 5000, 50 000 and 100 000 ms. Inset shows the pattern prepared by a single tip. (e) Fluorescence intensity of features printed with a dwell time of 5 s. The x-axis corresponds to the white line from bottom to top in (d). (f) The relationship between the square root of dwell time and feature diameter during patterning of 1 by PPL. An average variation of 3% in diameter was observed. The cartoon represents the increasing feature size as a function of dwell time.

