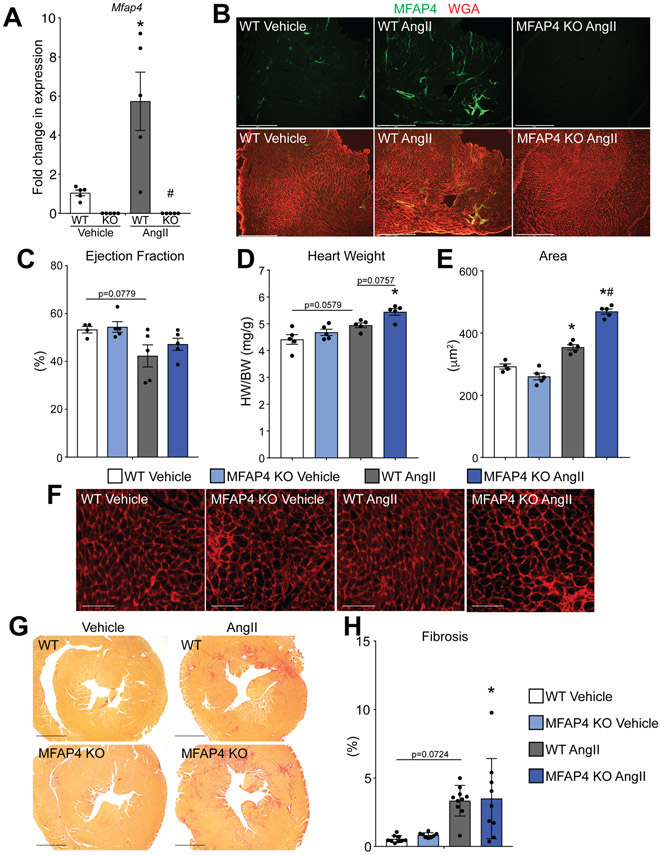
Figure 3. MFAP4 KO mice develop increased hypertrophy with angiotensin II treatment.
A. qPCR analysis for Mfap4 relative to Rpl7 in the indicated groups (all n=5) after 1 week of angiotensin (AngII) or vehicle (Veh) treatment. (Two-way ANOVA results: WT Veh vs AngII *p=0.0045; WT vs KO AngII #p=0.00090). B. Immunofluorescence staining of MFAP4 (green) and wheat germ agglutinin (WGA; red) in the indicated groups. Scale bar, 500 μm. C. Echocardiographic quantification of percentage ejection fraction in WT and MFAP4 KO mice following 1 week of vehicle or AngII treatment (all groups n=5). (Two-way ANOVA results: WT Veh vs AngII p=0.0779). D. Gravimetric analysis of heart weight to body weight ratio (HW/BW) in the indicated groups 1 week after vehicle or AngII administration (all groups n=5). (Two-way ANOVA results: WT Veh vs AngII p=0.0579; KO Veh vs AngII *p=0.0062; WT vs KO AngII p=0.0757). E. Quantification of cardiomyocyte cross-sectional area from WGA – stained cardiac cross-sections in the indicated groups (WT Veh n=4, KO Veh n=5, WT and KO Ang n=5). (Two-way ANOVA results: WT Veh vs AngII *p=0.0041; KO Veh vs AngII *p=0.000000030; WT vs KO AngII #p=0.000012). F. Representative images of WGA – stained cardiac cross-sections in the indicated groups. Scale bar, 50 μm. G. Representative images of picrosirius red – stained cardiac cross-sections in the indicated groups. Scale bar, 1 mm. H. Quantification of percent fibrosis from picrosirius red - stained cardiac cross-sections in the indicated groups (WT Veh n=9, KO Veh n=8, WT Ang n=10, KO Ang n=9). (Two-way ANOVA results: WT Veh vs AngII *p=0.0050; KO Veh vs AngII *p=0.0078).

