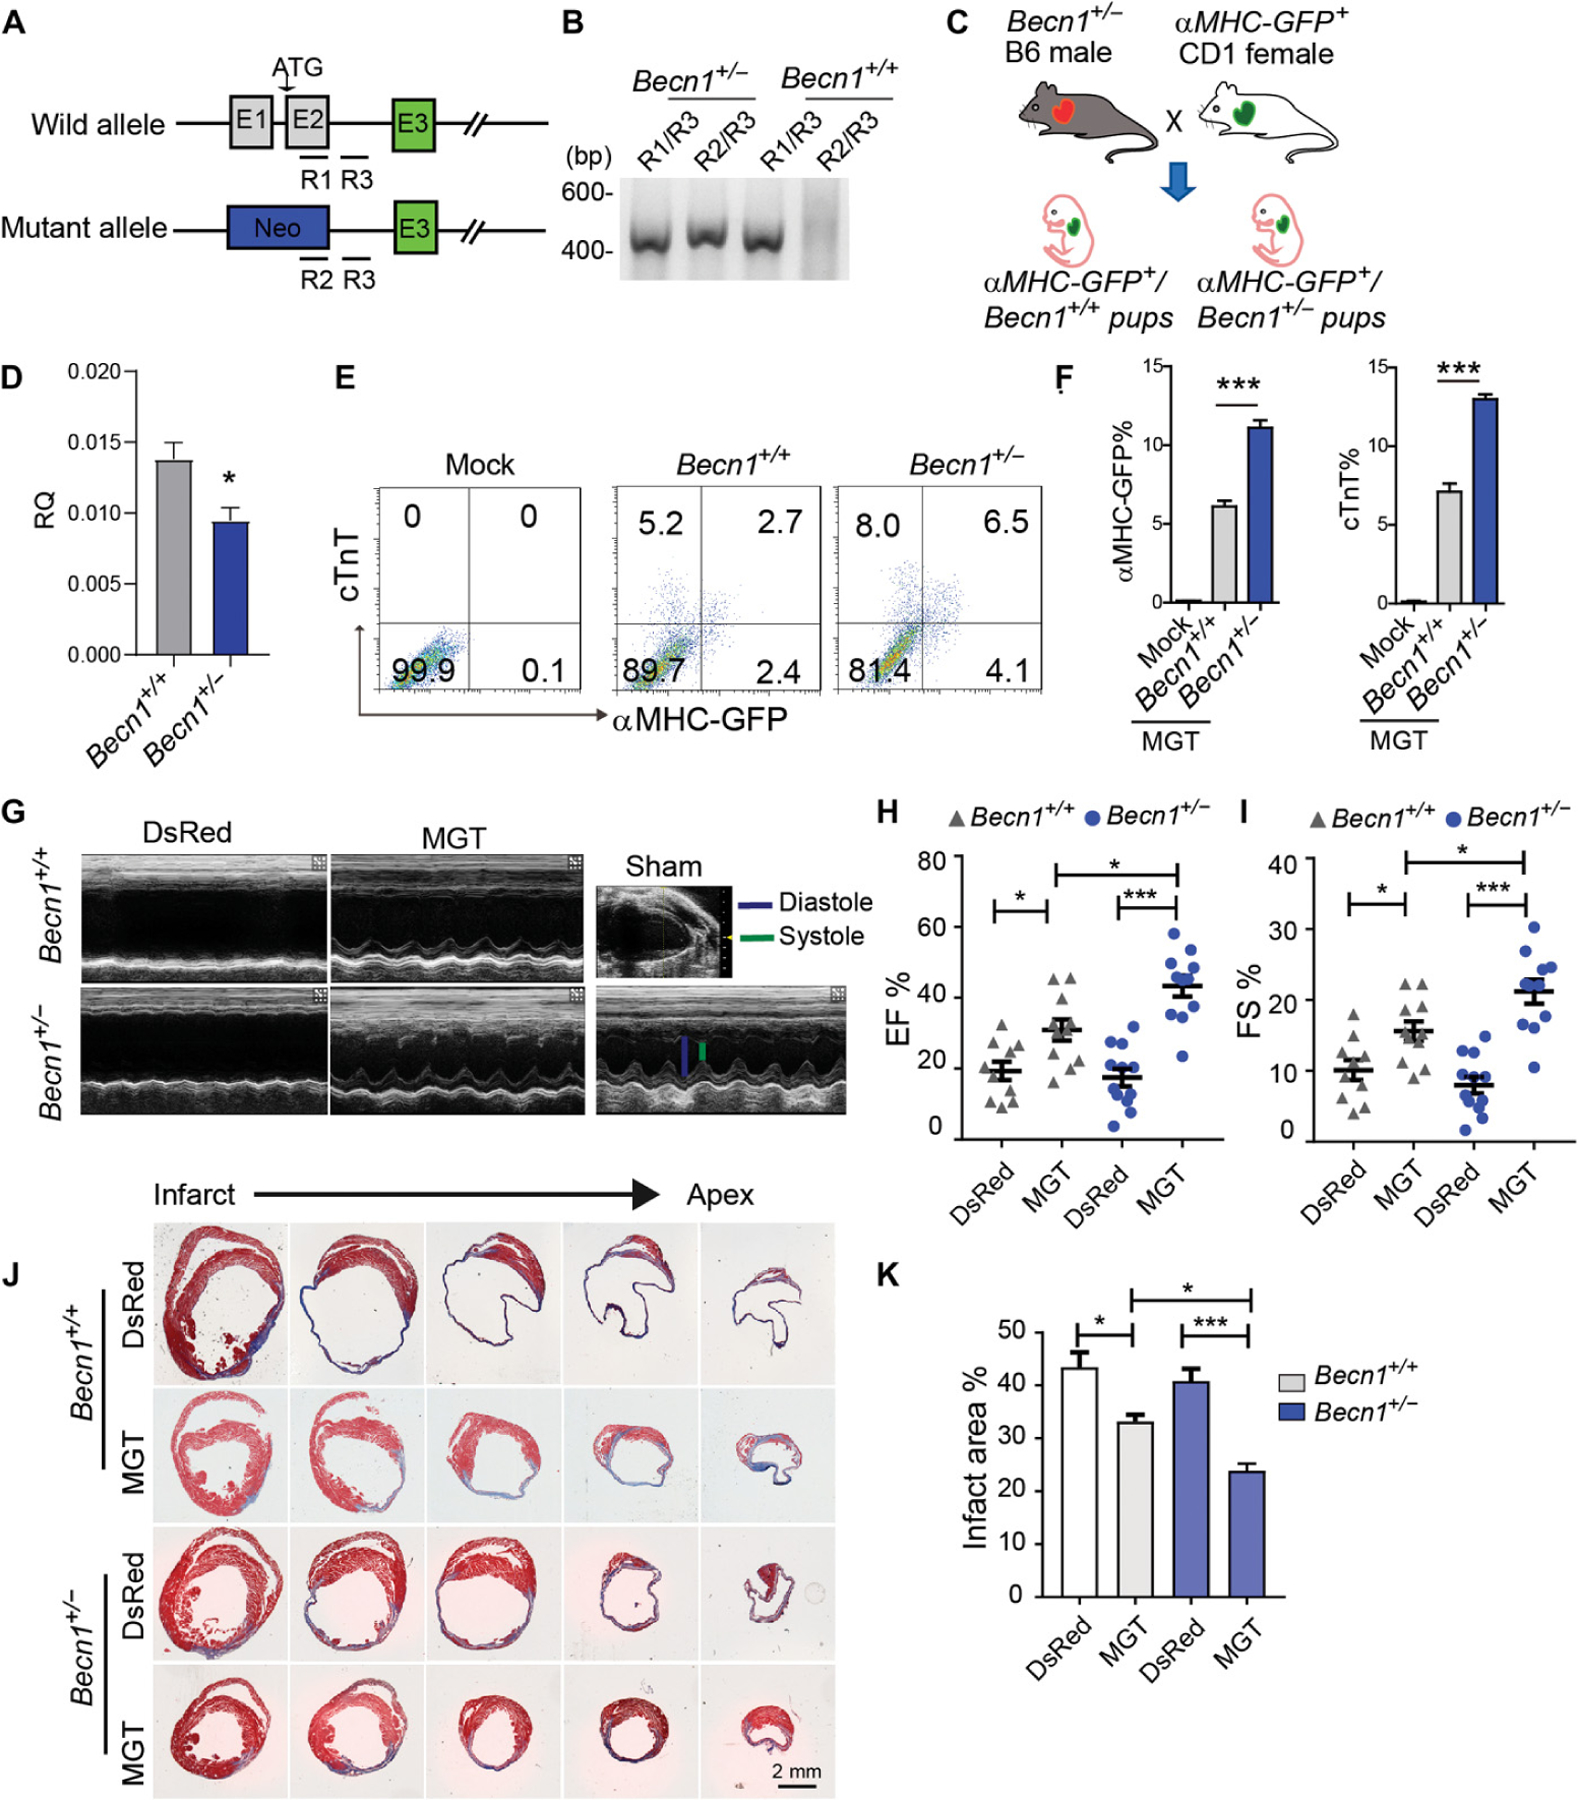
Fig. 4. Heterozygous loss of function of Becn1 enhanced reprogramming and improved heart function after MI.

(A) Schematic of Becn1 heterozygous mutant mouse. R1 to R3 indicate the location of PCR primers for genotyping. (B) Representative genotyping results from wild-type (Becn1+/+) or Becn1 heterozygous (Becn1+/−) mice. PCR primer pairs are listed above the gel plot. (C) Schematic of breeding strategy to cross αMHC-GFP reporter line with Becn1 mutant mouse line. (D) Relative expression of Becn1 in heterozygous ExCFs determined by qPCR. (E and F) Representative flow plots (E) and quantification data (F) for αMHC-GFP+ and cTnT+ cells 10 days after transduction of MGT to Becn1+/− and Becn1+/+ CFs. (G) Echocardiography to measure ventricular contractility 4 weeks after MI. (H and I) Quantification of 4-week ejection fraction (EF) (H) and FS (I) as absolute values is shown. (J and K) Representative histological heart sections with Masson trichrome staining and quantification (K) showing the areas of fibrosis among retroviral DsRed or G, M, and T delivered Becn1 mutant or wild-type mice. All experiments were repeated at least three times. Mean values from technical triplicates [except n = 4 for (F) and n = 5 to 10 in each group for (H) to (K)] were used for statistics. Groups were compared using two-tailed unpaired t test or one-way ANOVA with Tukey’s multiple comparisons test for multiple groups. Two-way ANOVA followed by Tukey post hoc test was used for (H), (I), and (K). Error bars indicate means ± SEM; *P < 0.05 and ***P < 0.001.
